React Performance tracks
React Performance tracks are specialized custom entries that appear on the Performance panel’s timeline in your browser developer tools.
These tracks are designed to provide developers with comprehensive insights into their React application’s performance by visualizing React-specific events and metrics alongside other critical data sources such as network requests, JavaScript execution, and event loop activity, all synchronized on a unified timeline within the Performance panel for a complete understanding of application behavior.
Usage
React Performance tracks are only available in development and profiling builds of React:
- Development: enabled by default.
- Profiling: you can either wrap a subtree that you want to instrument with
<Profiler>component or have React Developer Tools extension enabled. Tracks specific to React Server Components are not enabled in profiling builds.
If enabled, tracks should appear automatically in the traces you record with the Performance panel of browsers that provide extensibility APIs.
Tracks
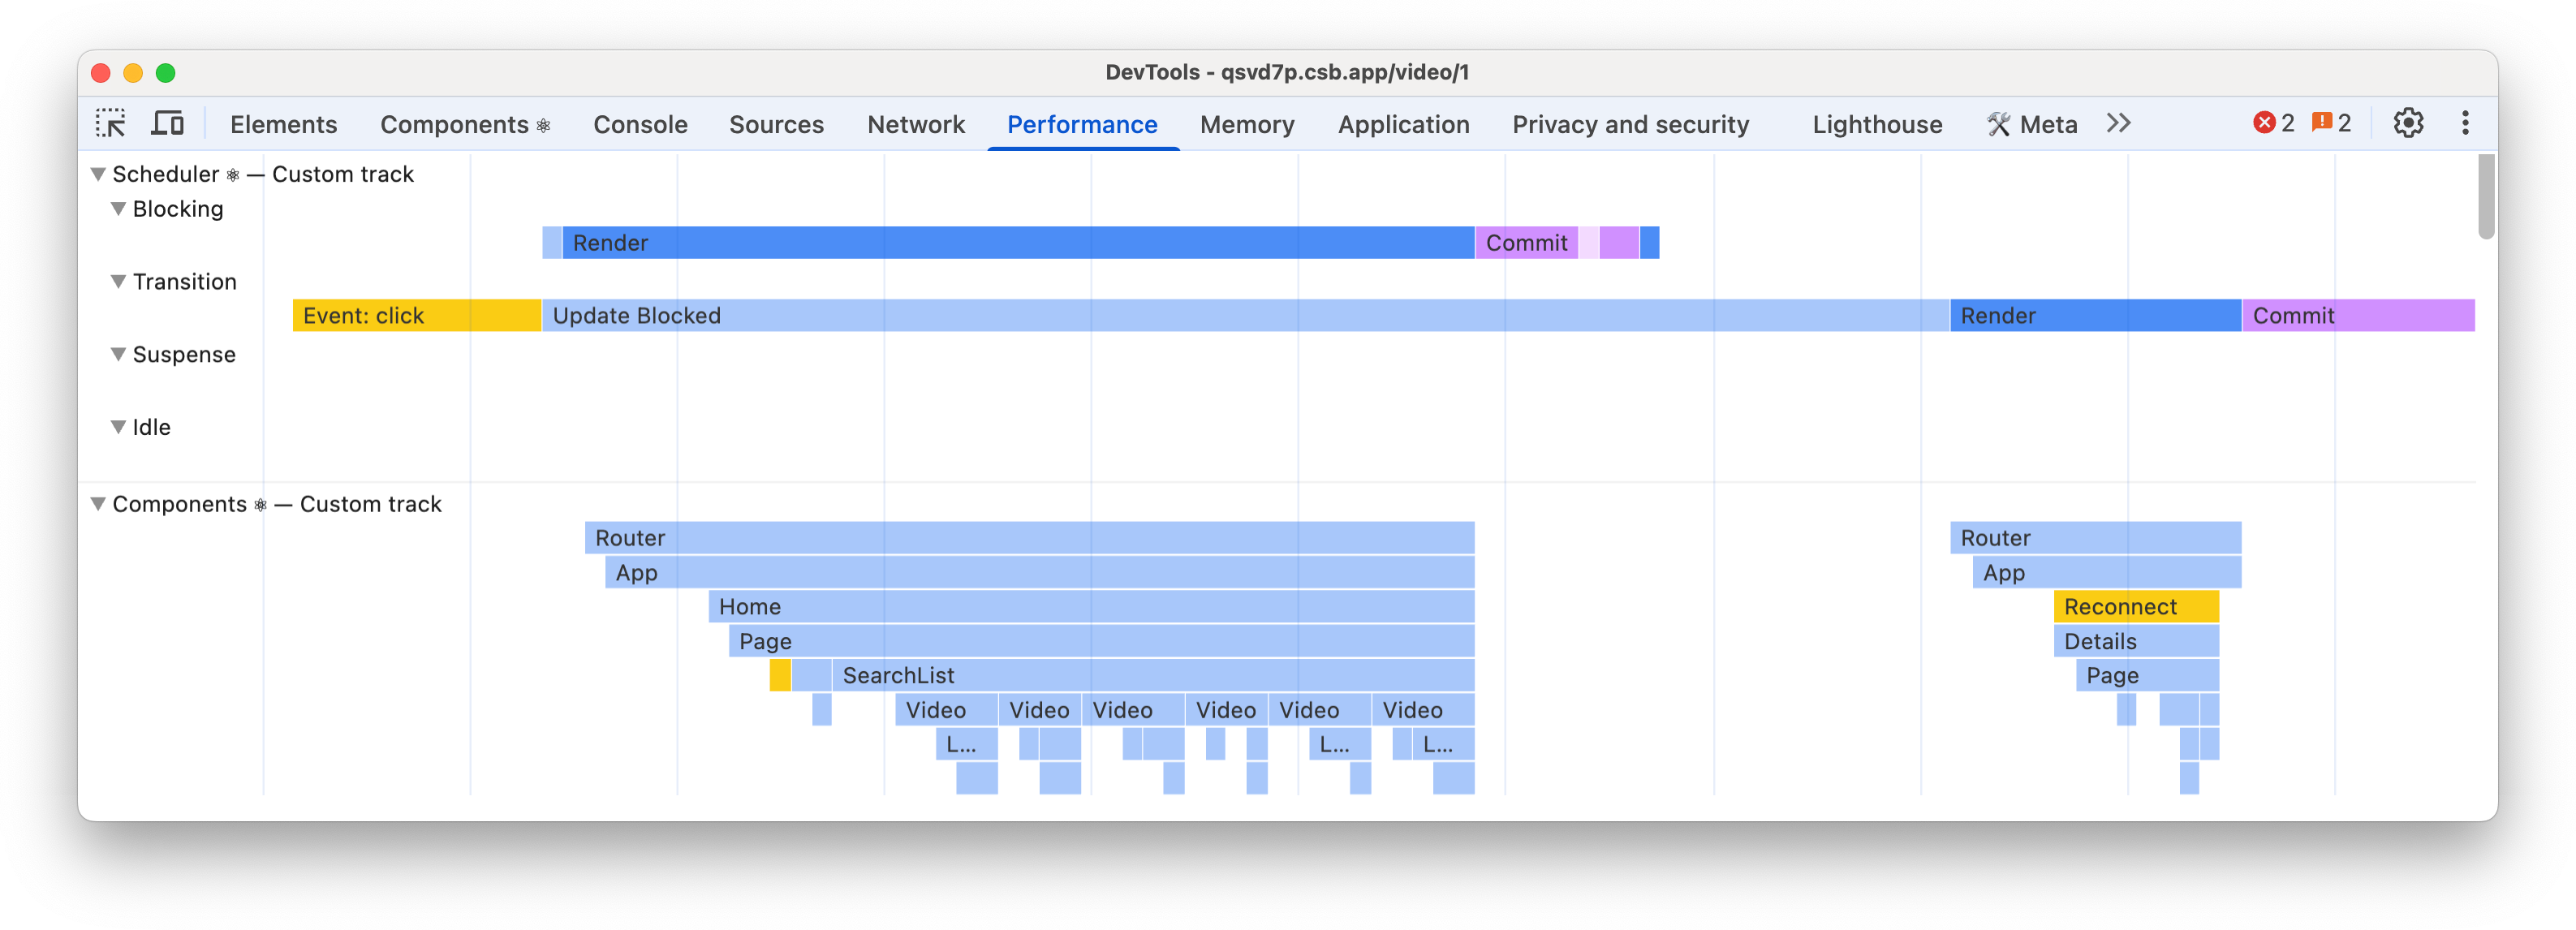
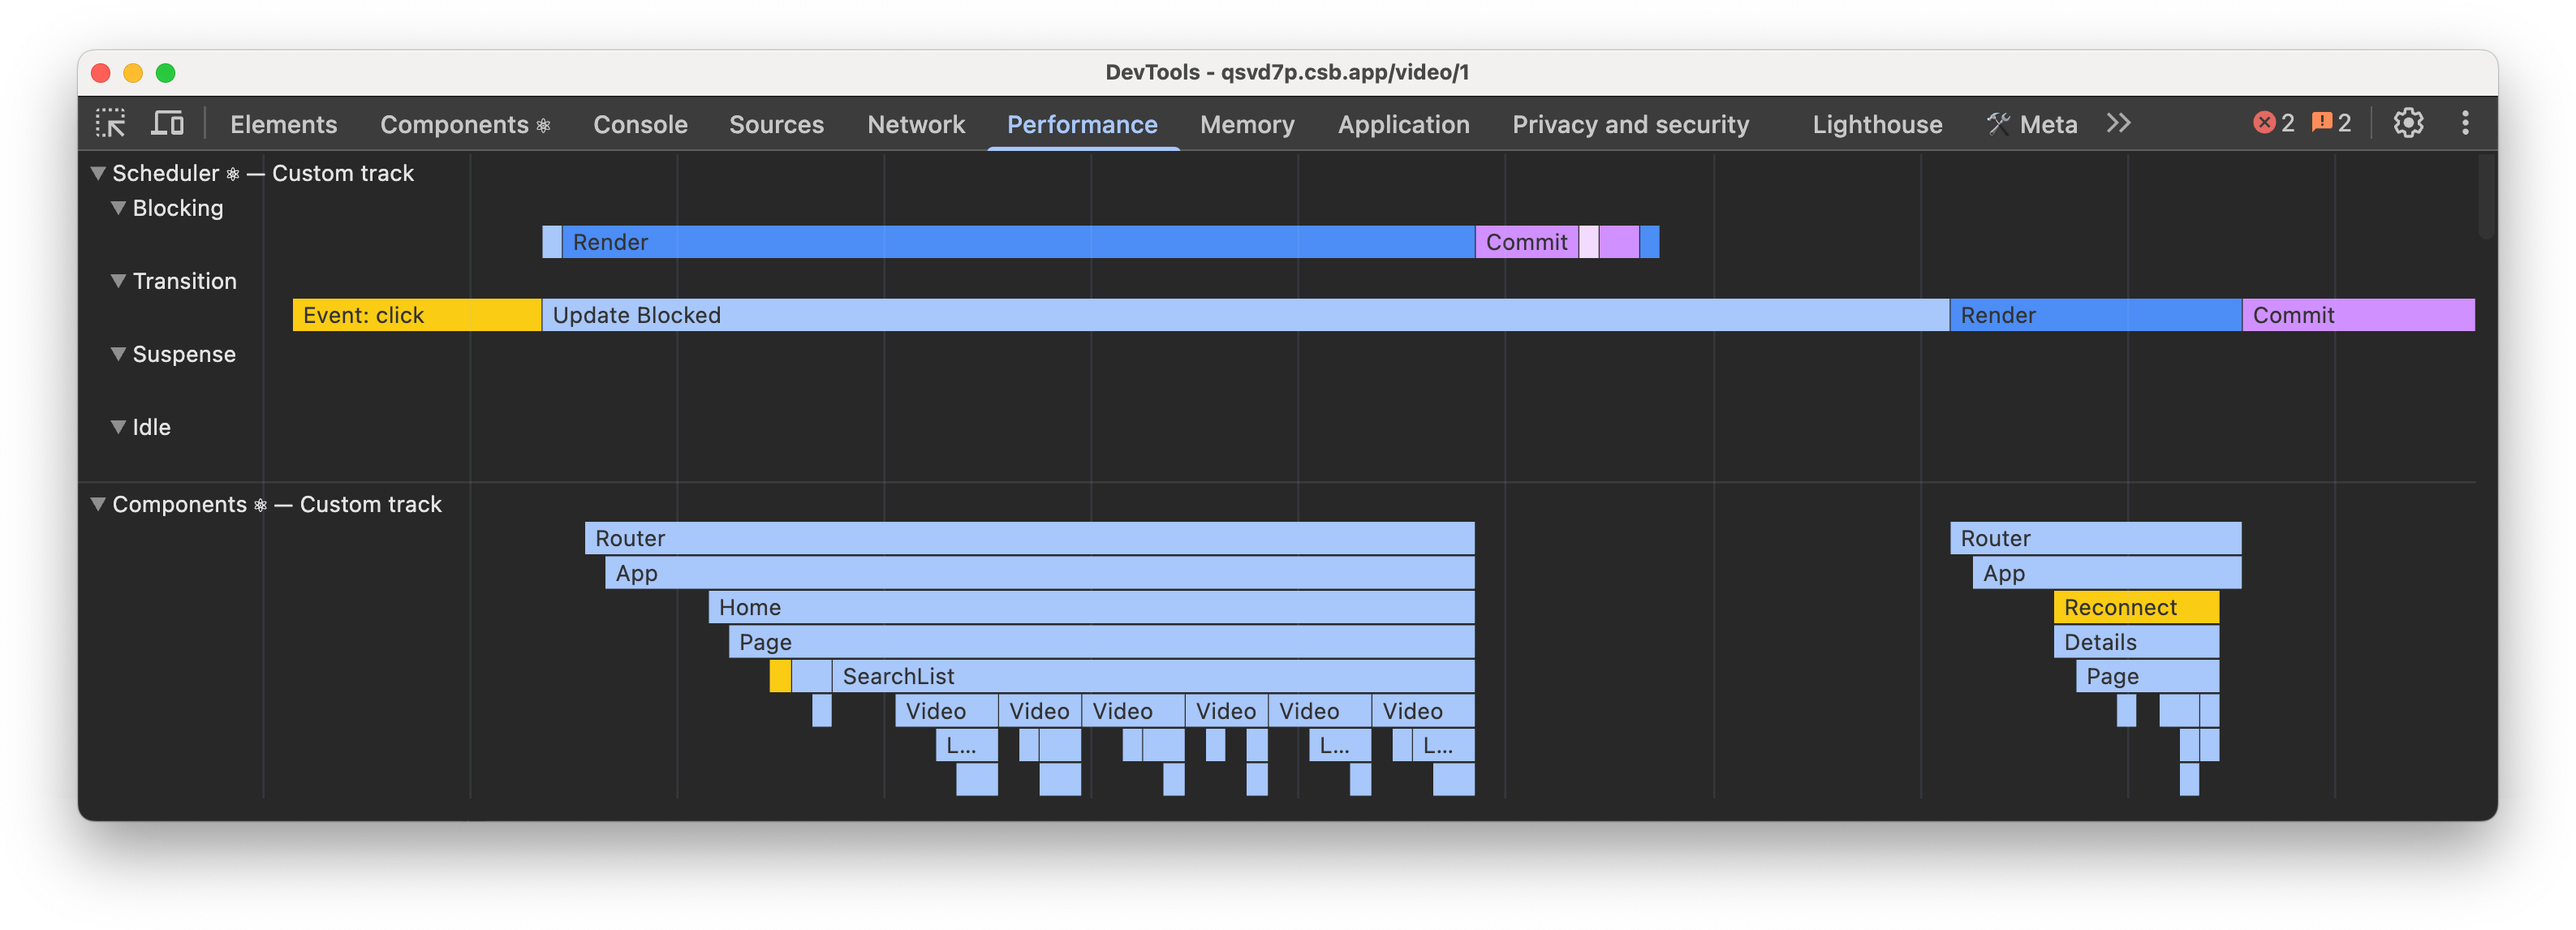
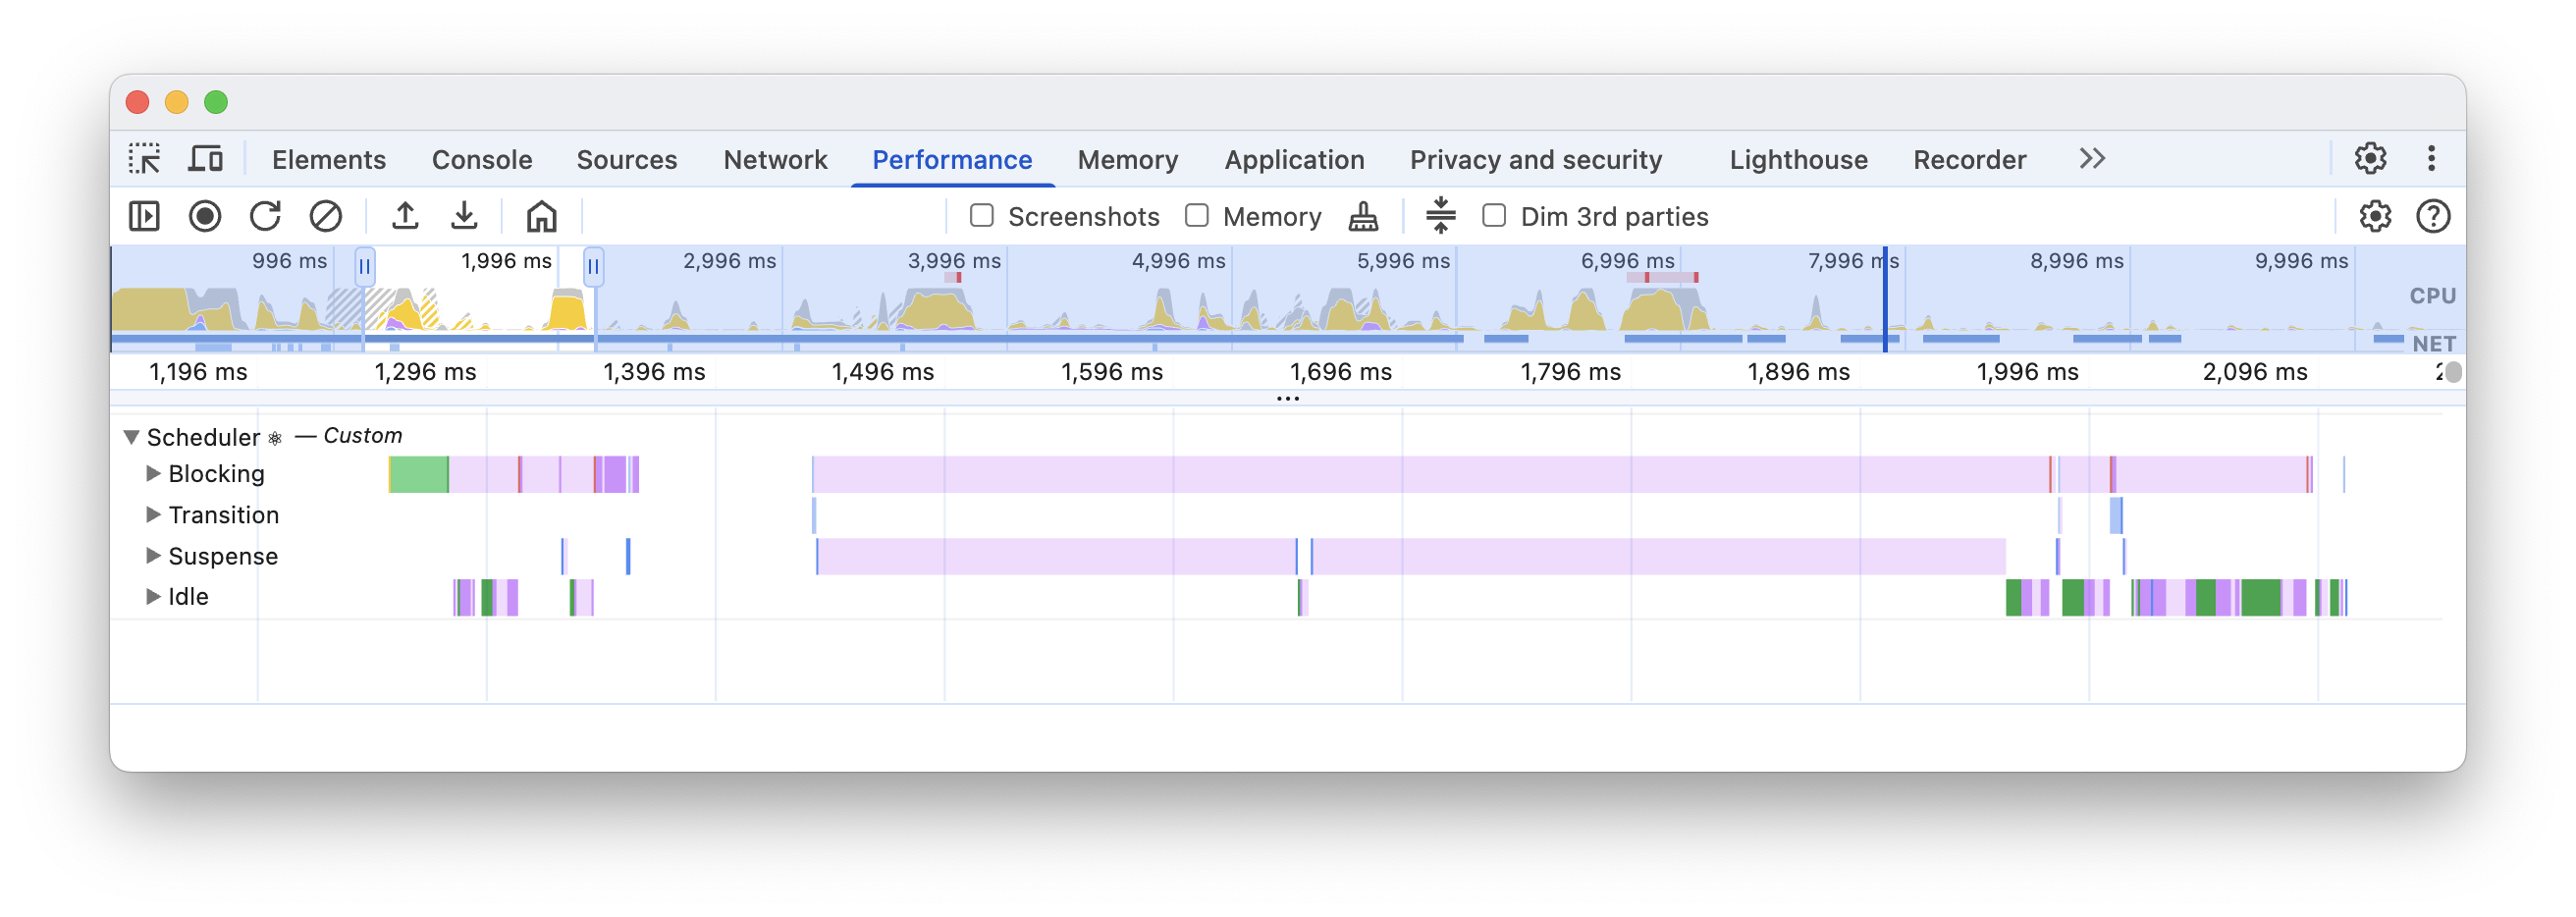
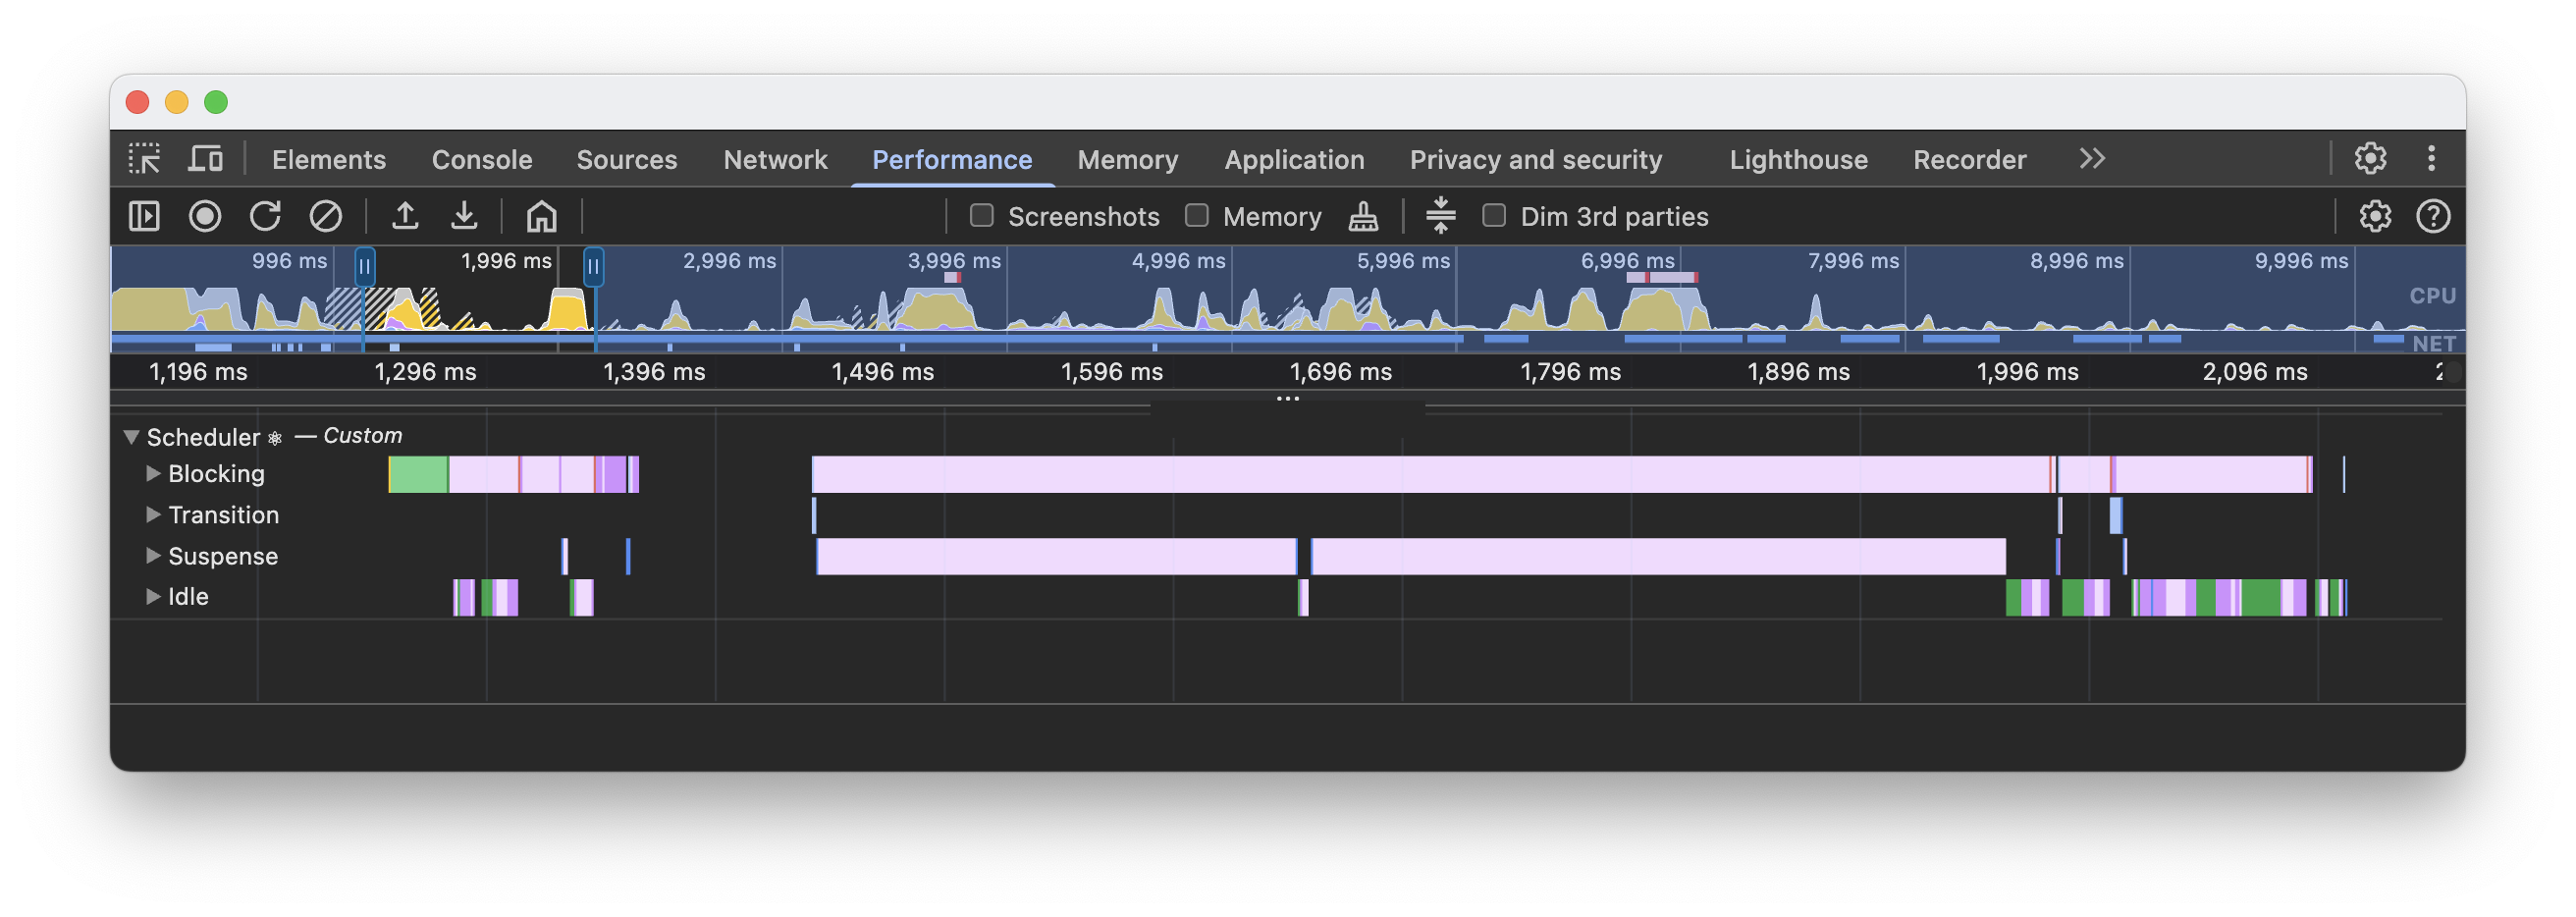
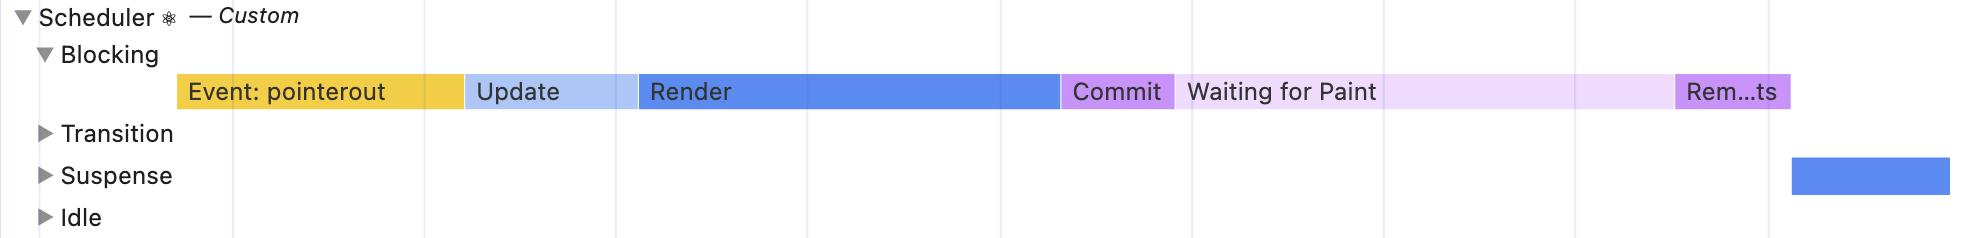
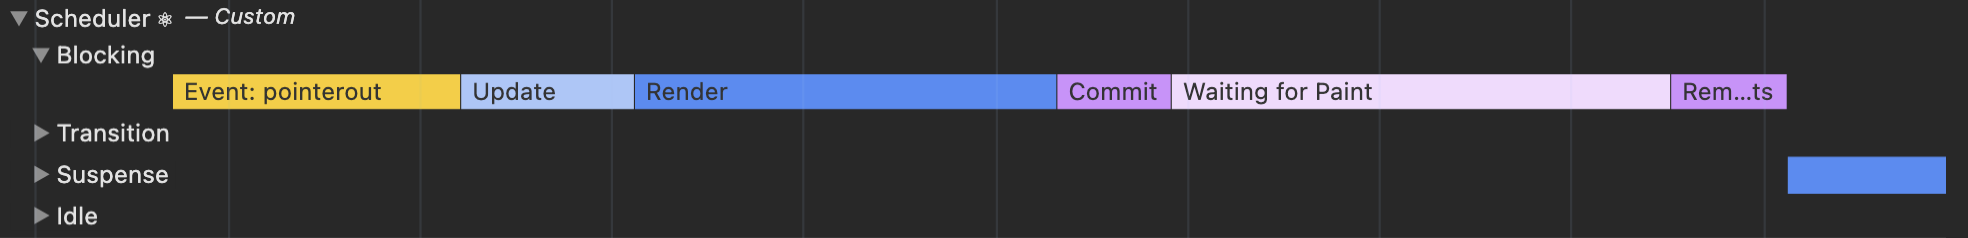
Scheduler
The Scheduler is an internal React concept used for managing tasks with different priorities. This track consists of 4 subtracks, each representing work of a specific priority:
- Blocking - The synchronous updates, which could’ve been initiated by user interactions.
- Transition - Non-blocking work that happens in the background, usually initiated via
startTransition. - Suspense - Work related to Suspense boundaries, such as displaying fallbacks or revealing content.
- Idle - The lowest priority work that is done when there are no other tasks with higher priority.
Renders
Every render pass consists of multiple phases that you can see on a timeline:
- Update - this is what caused a new render pass.
- Render - React renders the updated subtree by calling render functions of components. You can see the rendered components subtree on Components track, which follows the same color scheme.
- Commit - After rendering components, React will submit the changes to the DOM and run layout effects, like
useLayoutEffect. - Remaining Effects - React runs passive effects of a rendered subtree. This usually happens after the paint, and this is when React runs hooks like
useEffect. One known exception is user interactions, like clicks, or other discrete events. In this scenario, this phase could run before the paint.
Learn more about renders and commits.
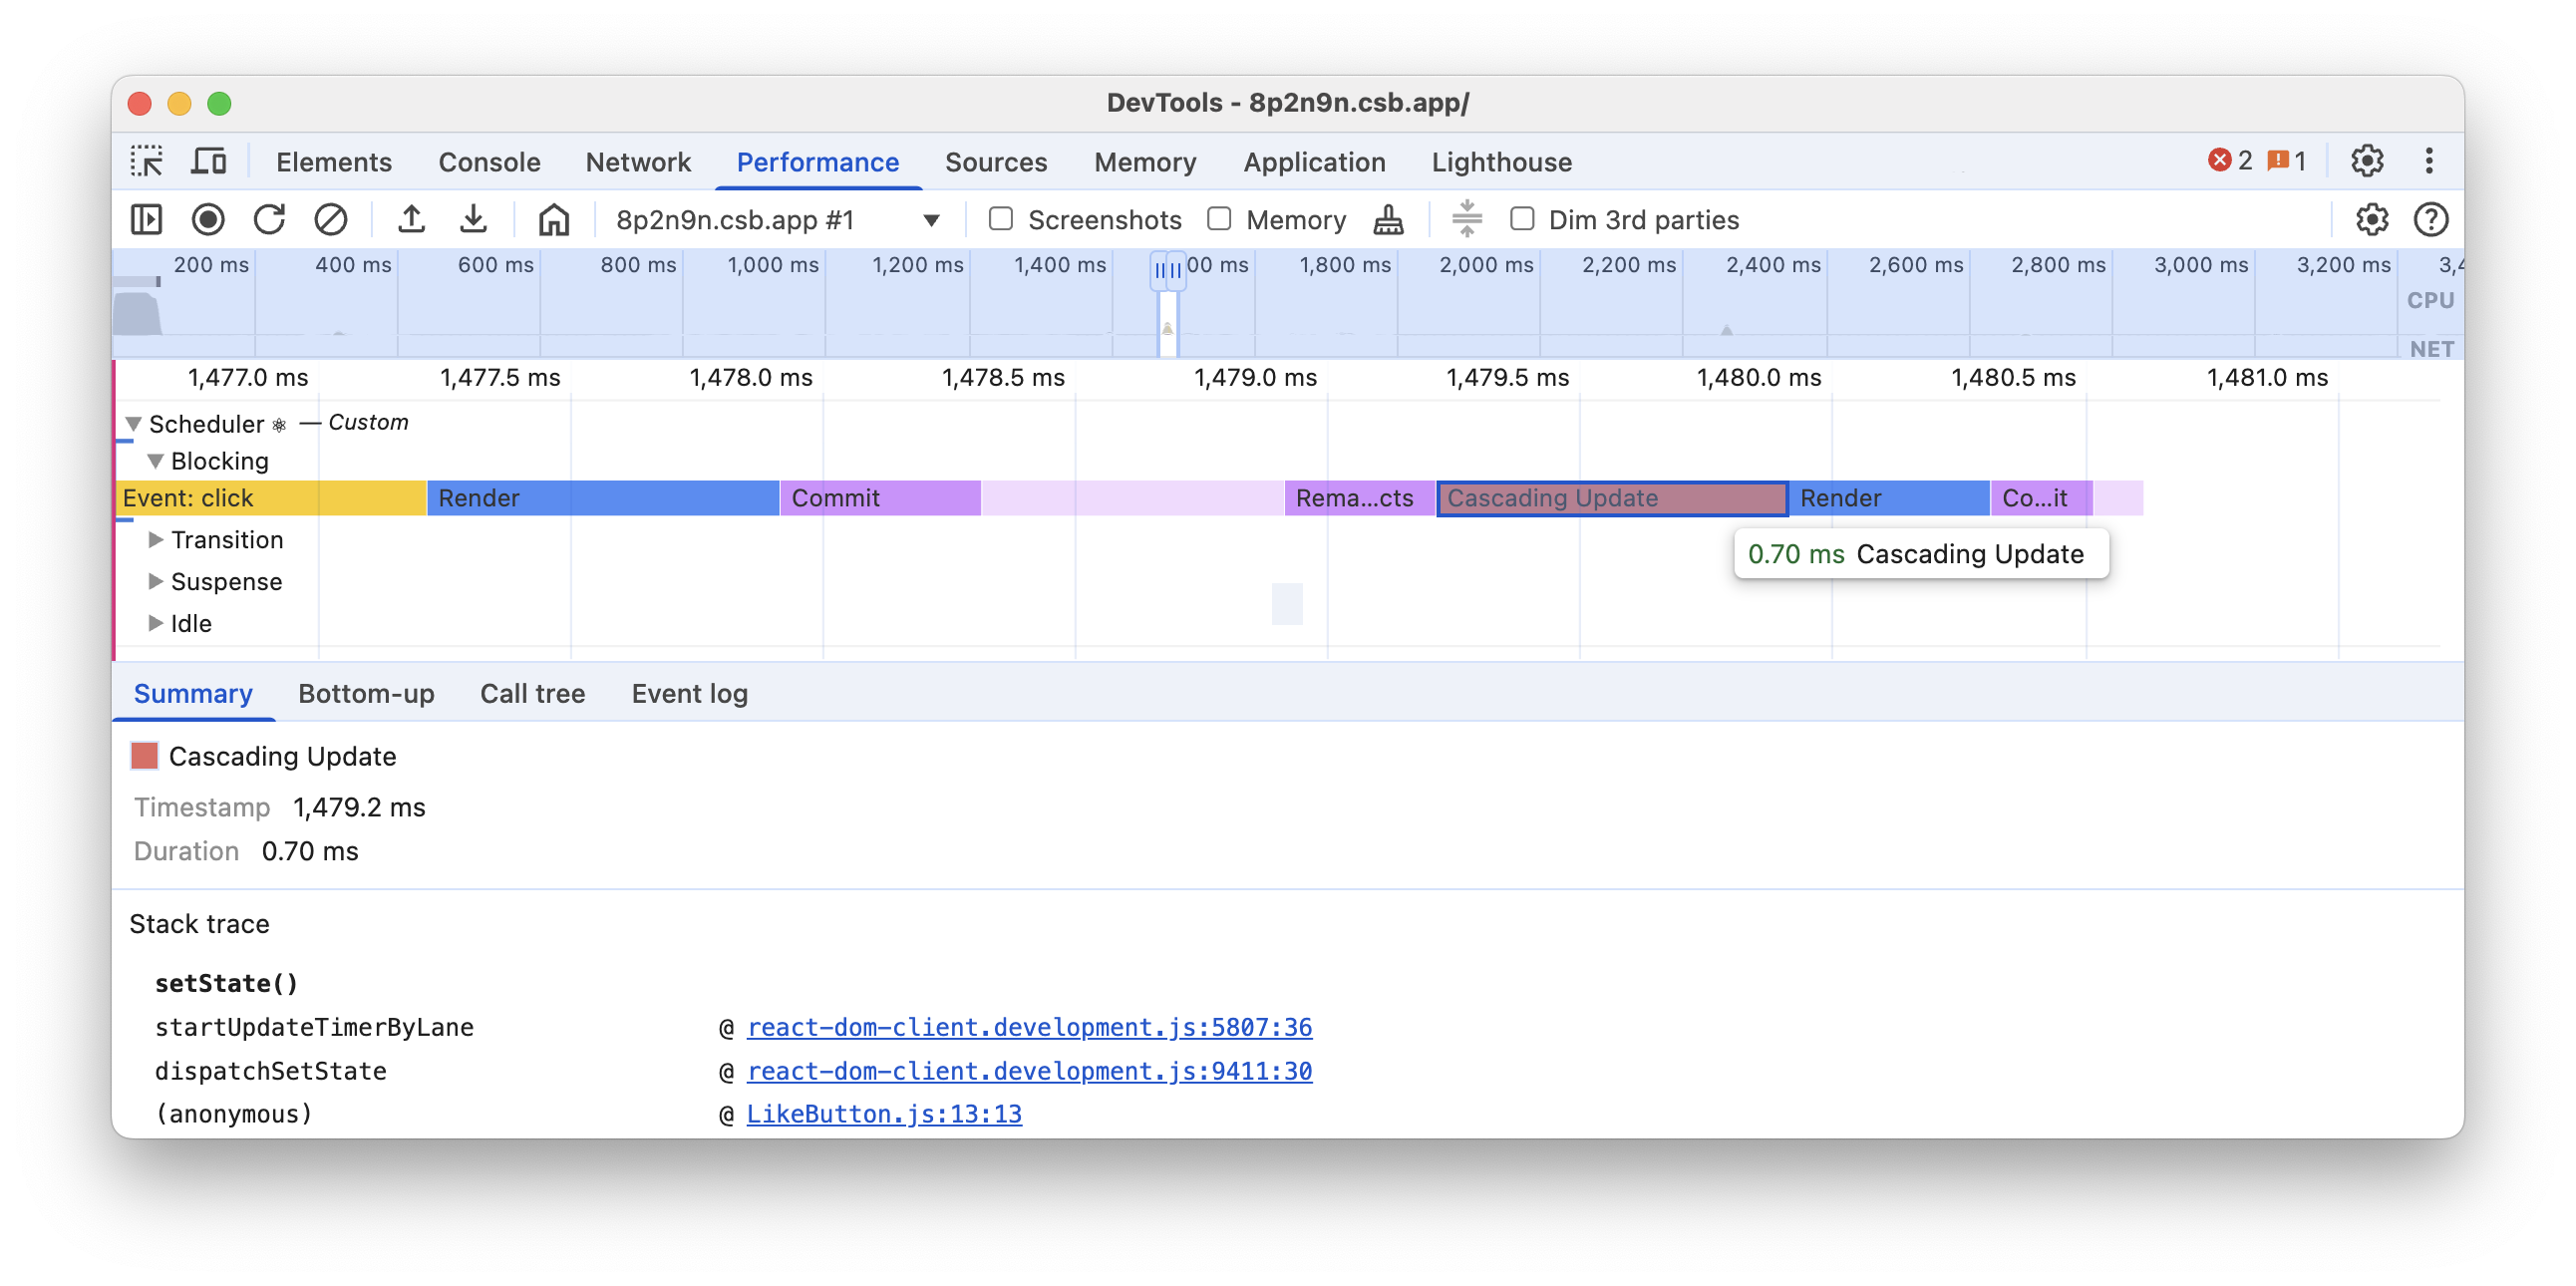
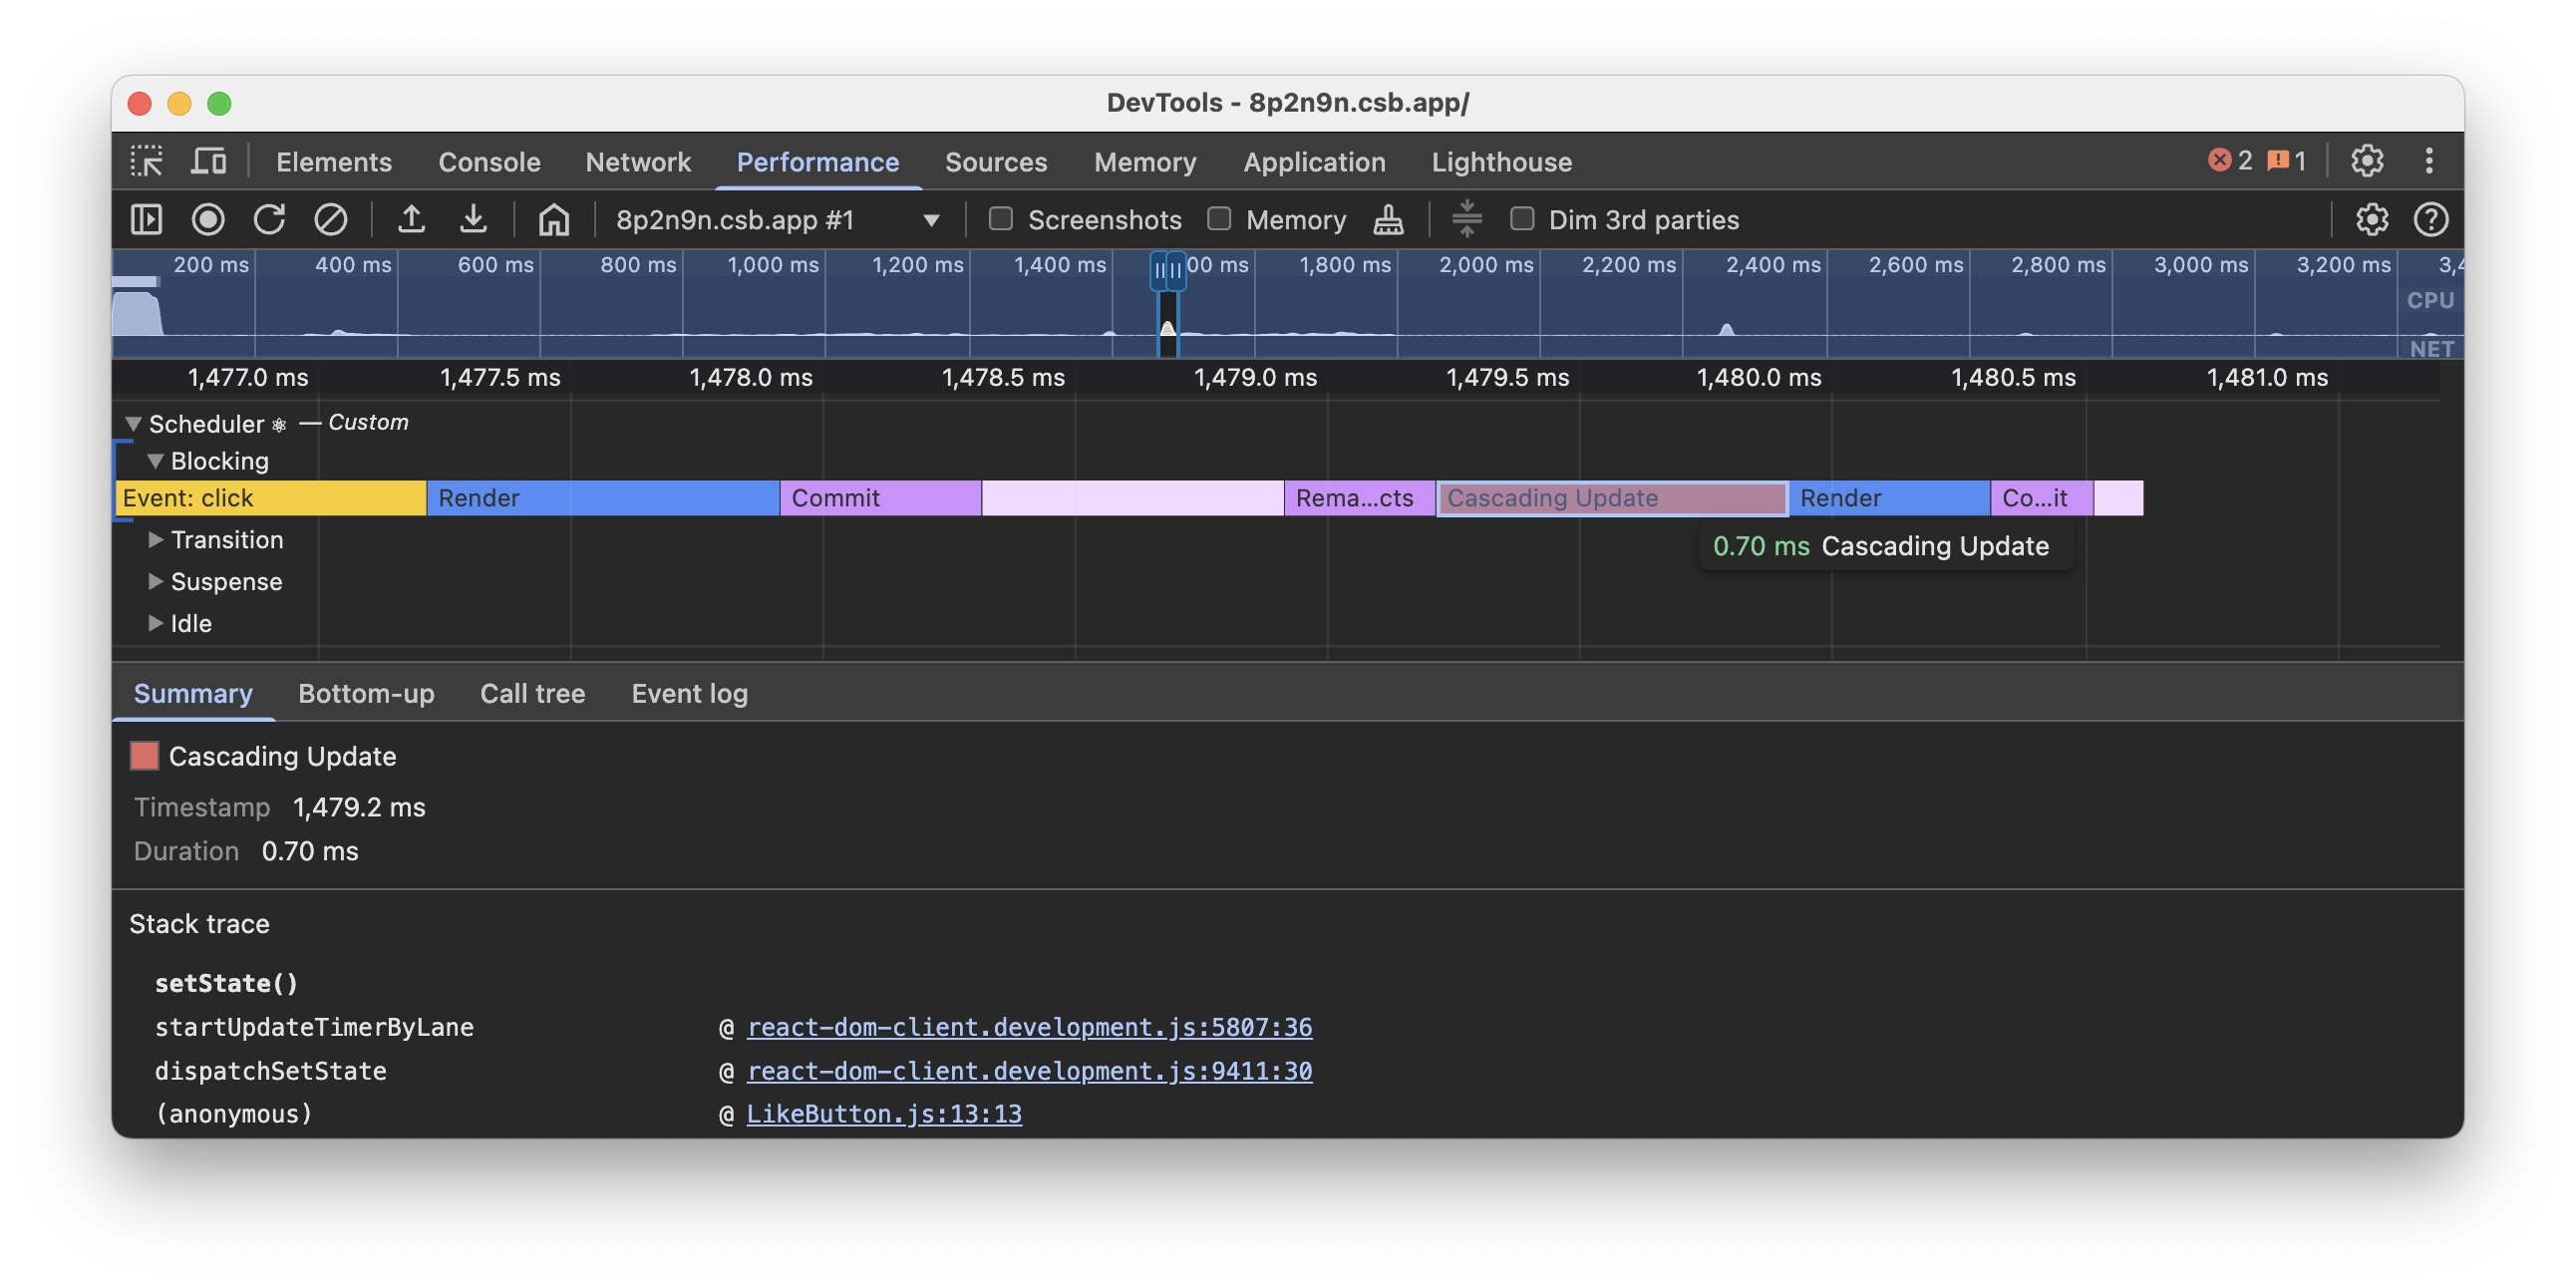
Cascading updates
Cascading updates is one of the patterns for performance regressions. If an update was scheduled during a render pass, React could discard completed work and start a new pass.
In development builds, React can show you which Component scheduled a new update. This includes both general updates and cascading ones. You can see the enhanced stack trace by clicking on the “Cascading update” entry, which should also display the name of the method that scheduled an update.
Components
The Components track visualizes the durations of React components. They are displayed as a flamegraph, where each entry represents the duration of the corresponding component render and all its descendant children components.
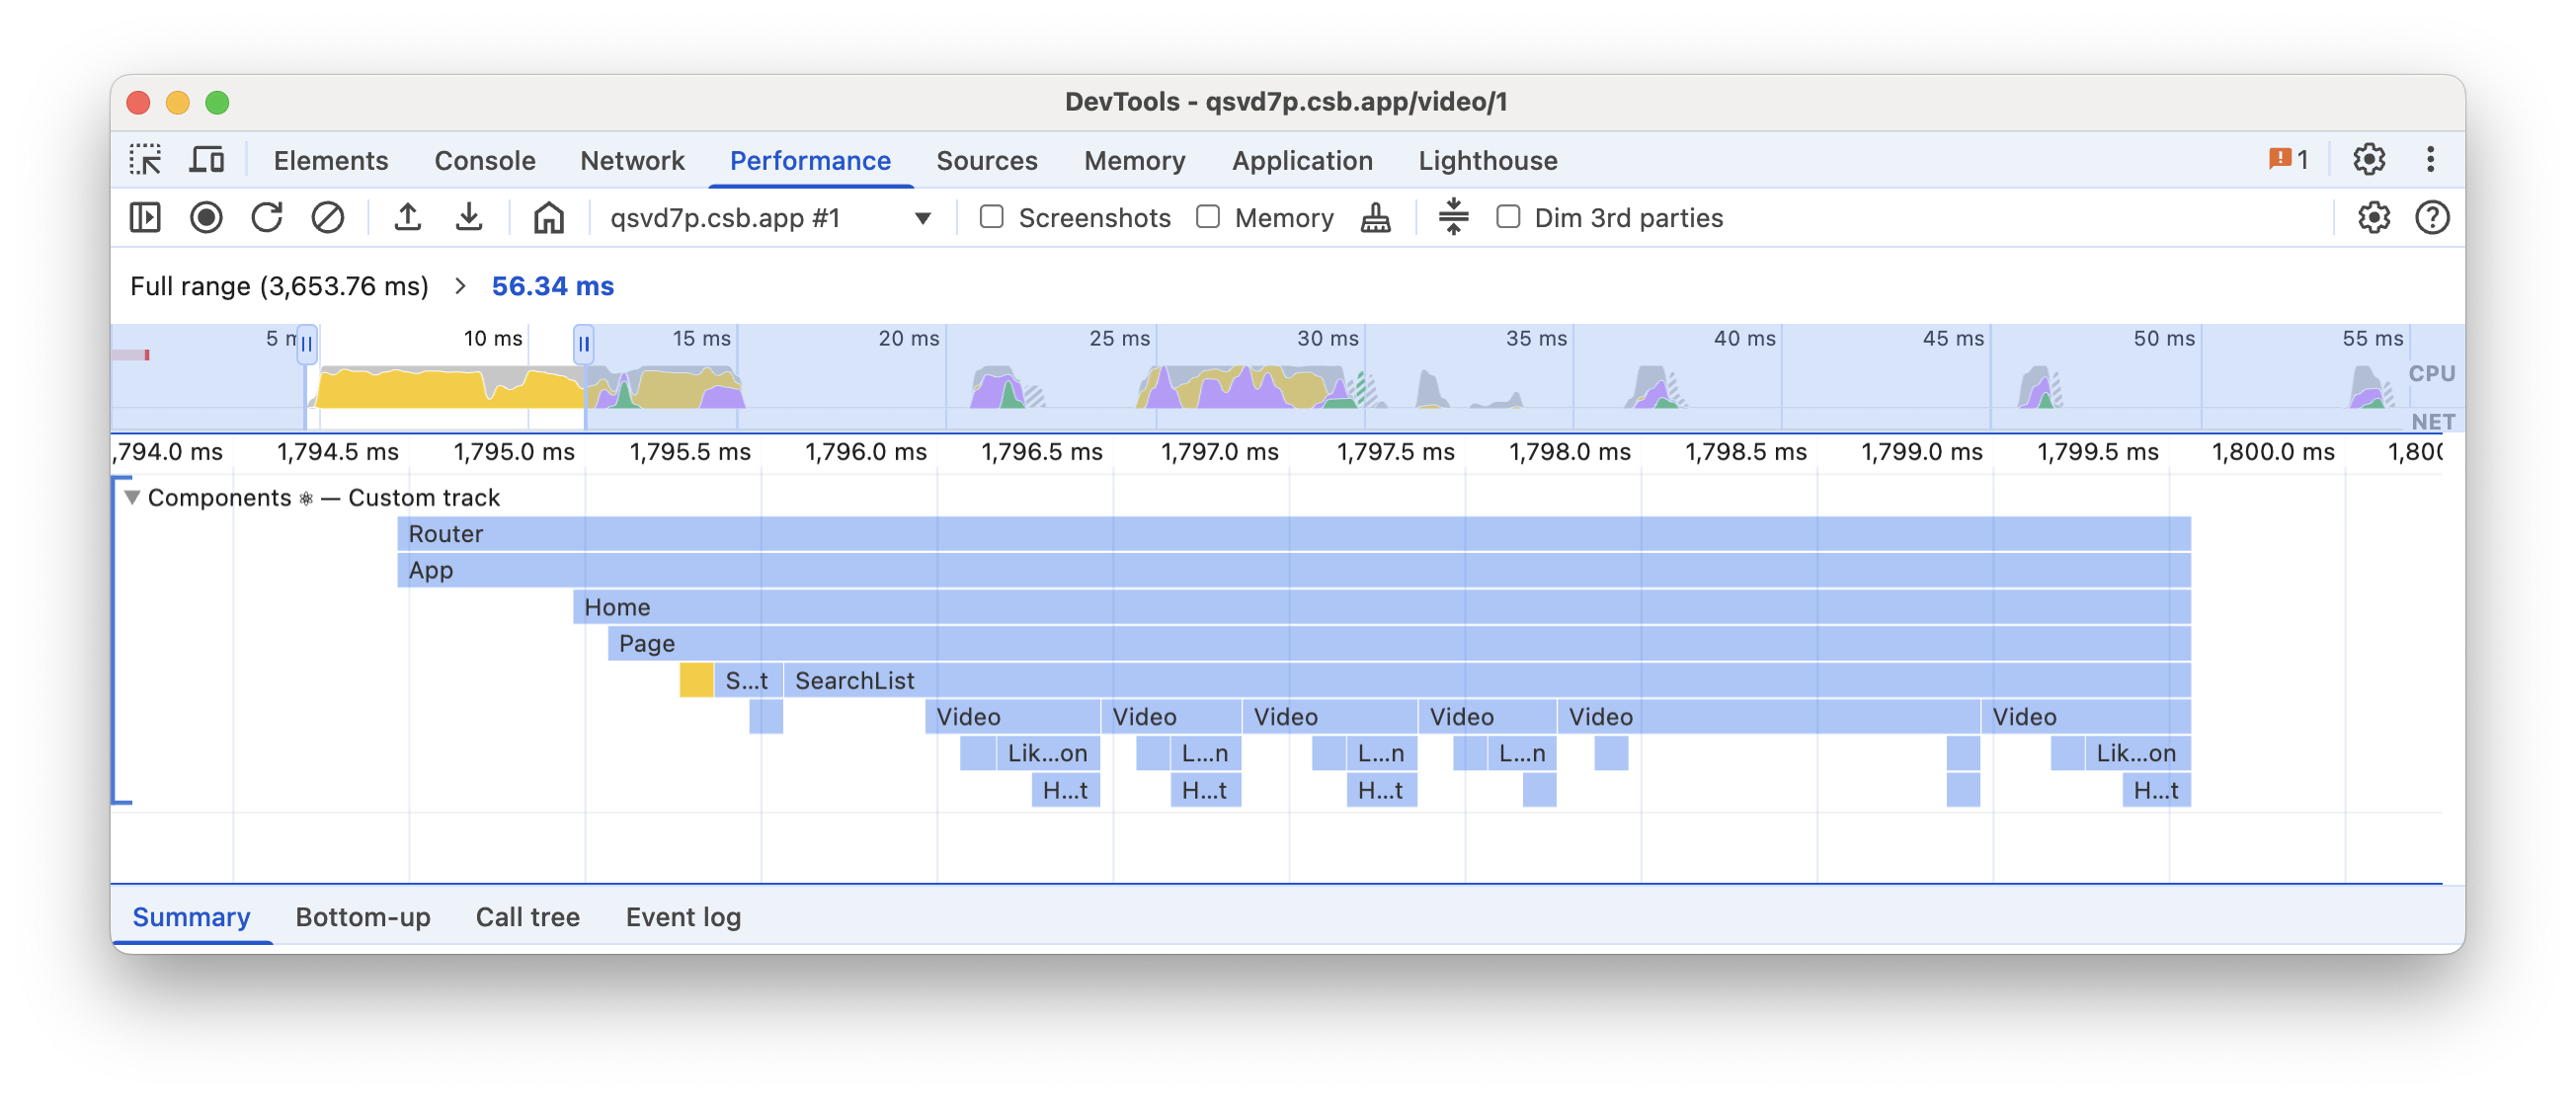
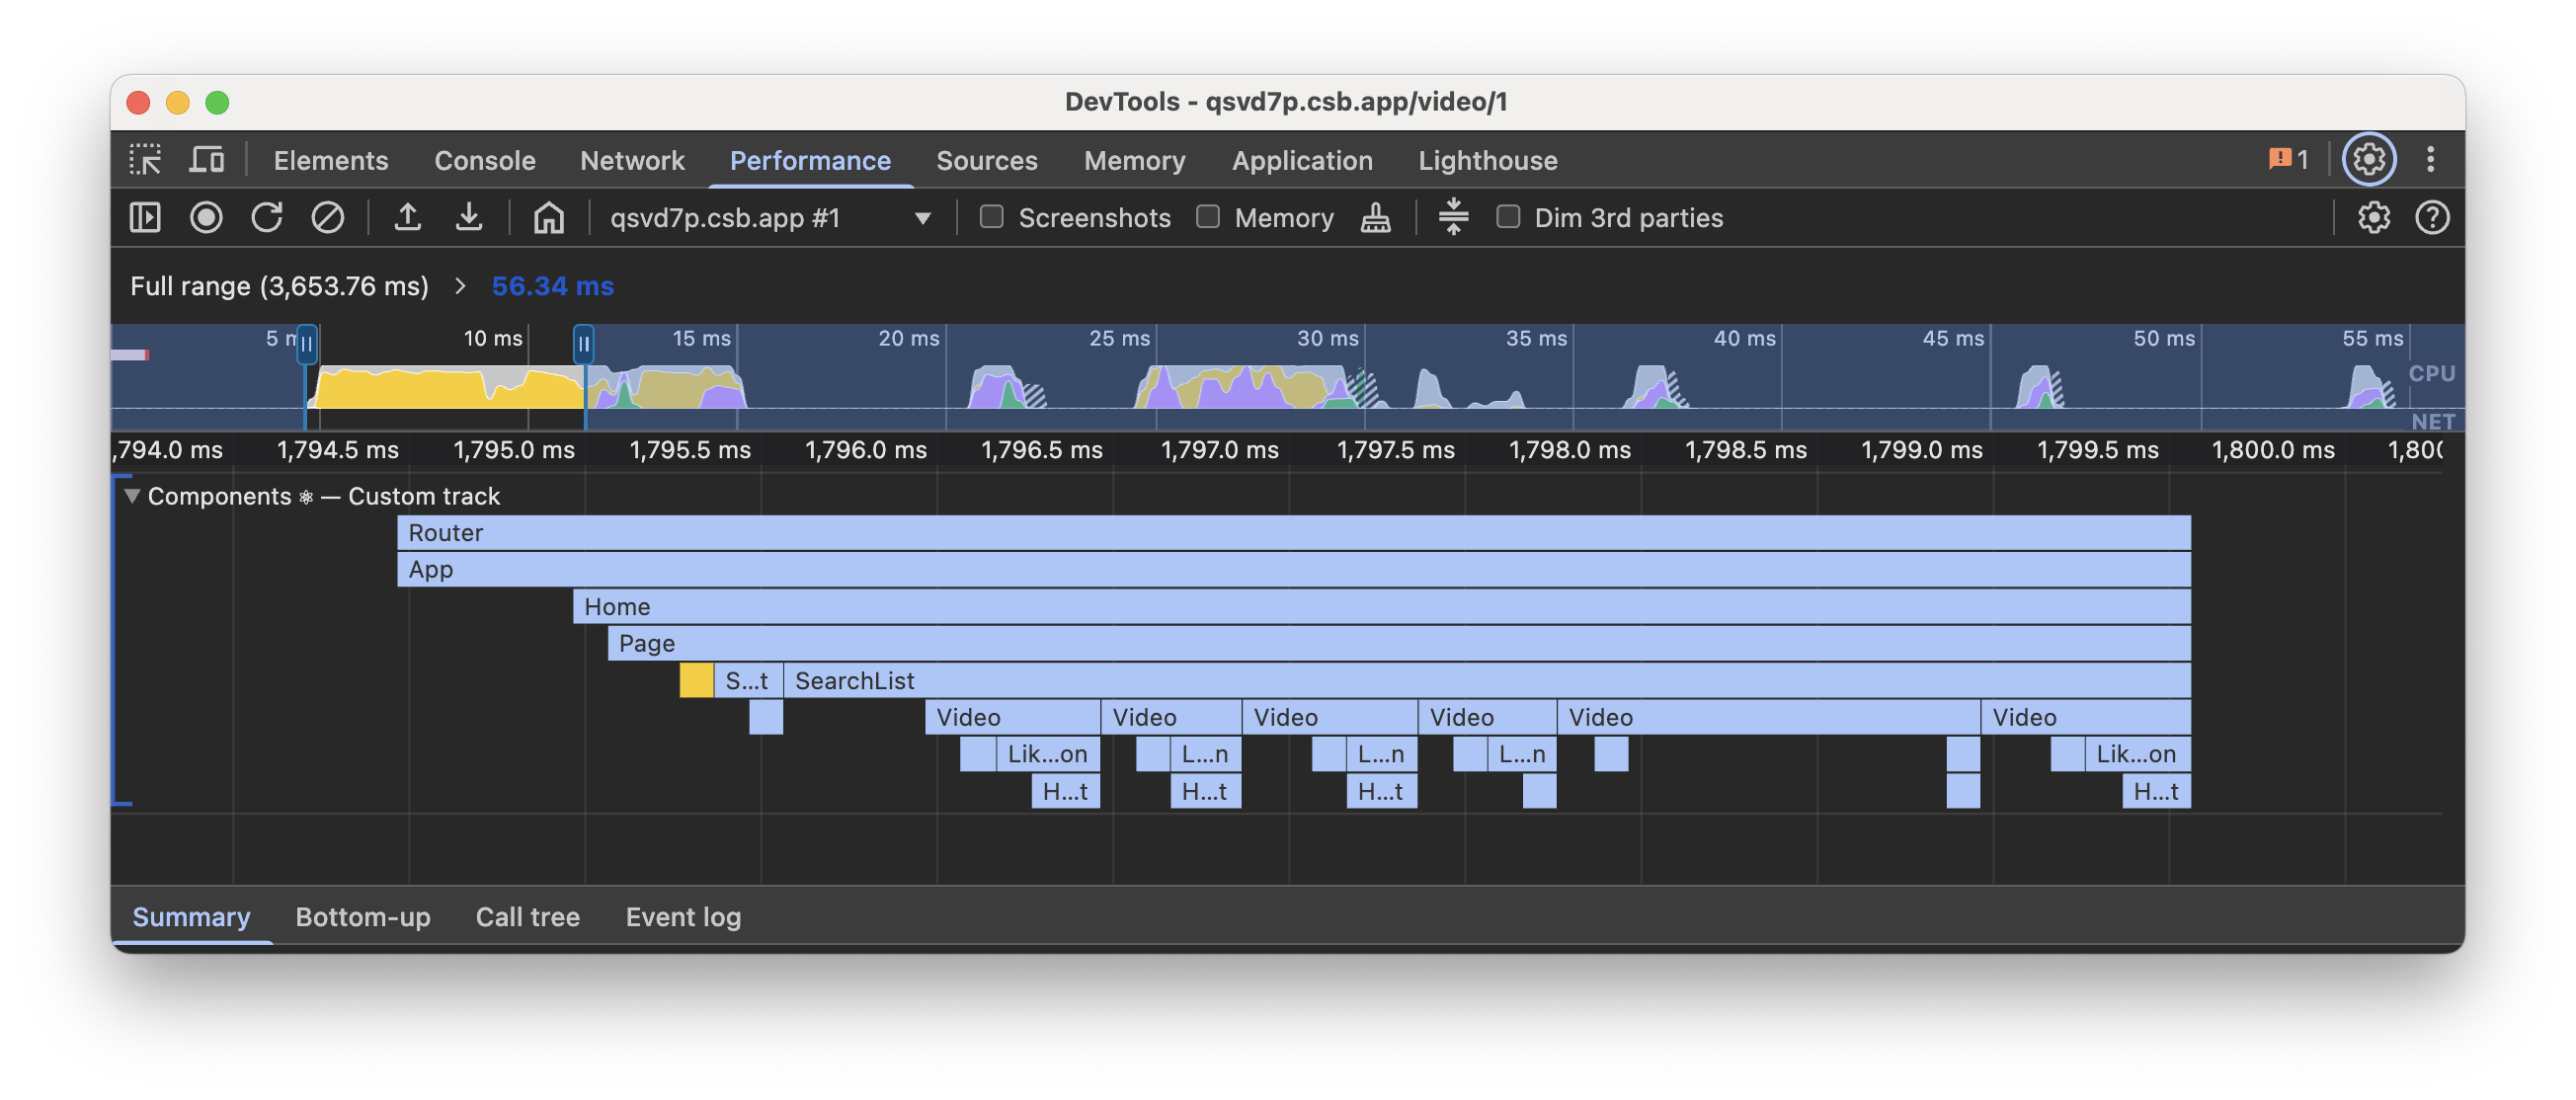
Similar to render durations, effect durations are also represented as a flamegraph, but with a different color scheme that aligns with the corresponding phase on the Scheduler track.
Additional events may be displayed during the render and effects phases:
- Mount - A corresponding subtree of component renders or effects was mounted.
- Unmount - A corresponding subtree of component renders or effects was unmounted.
- Reconnect - Similar to Mount, but limited to cases when
<Activity>is used. - Disconnect - Similar to Unmount, but limited to cases when
<Activity>is used.
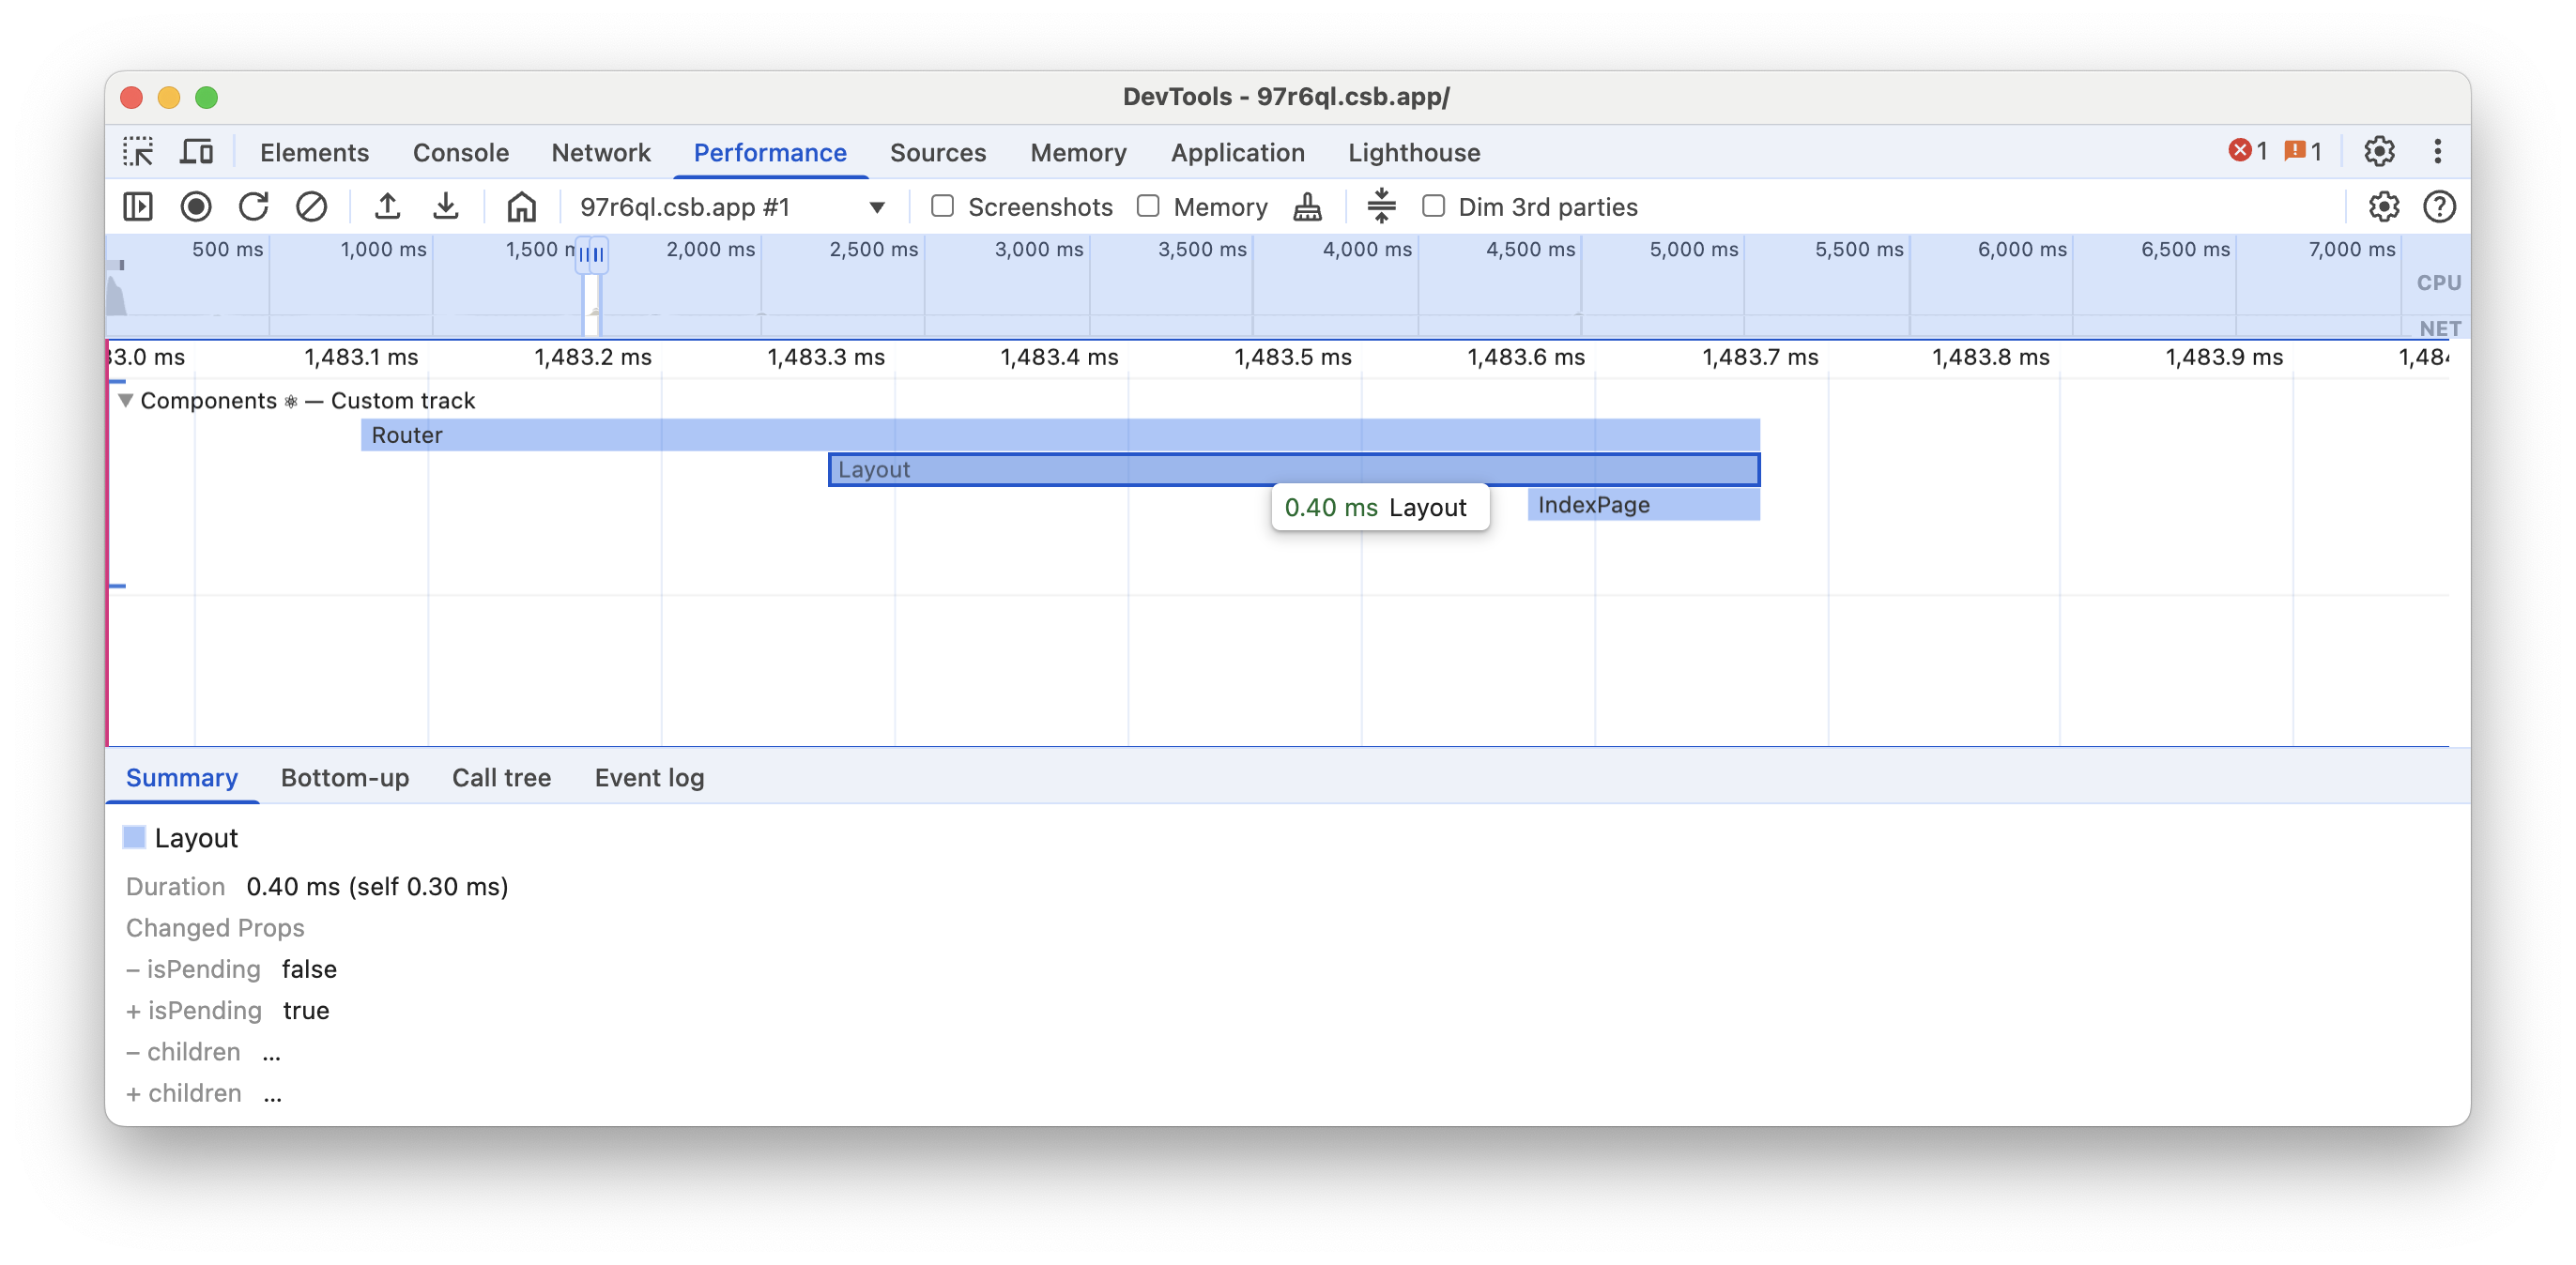
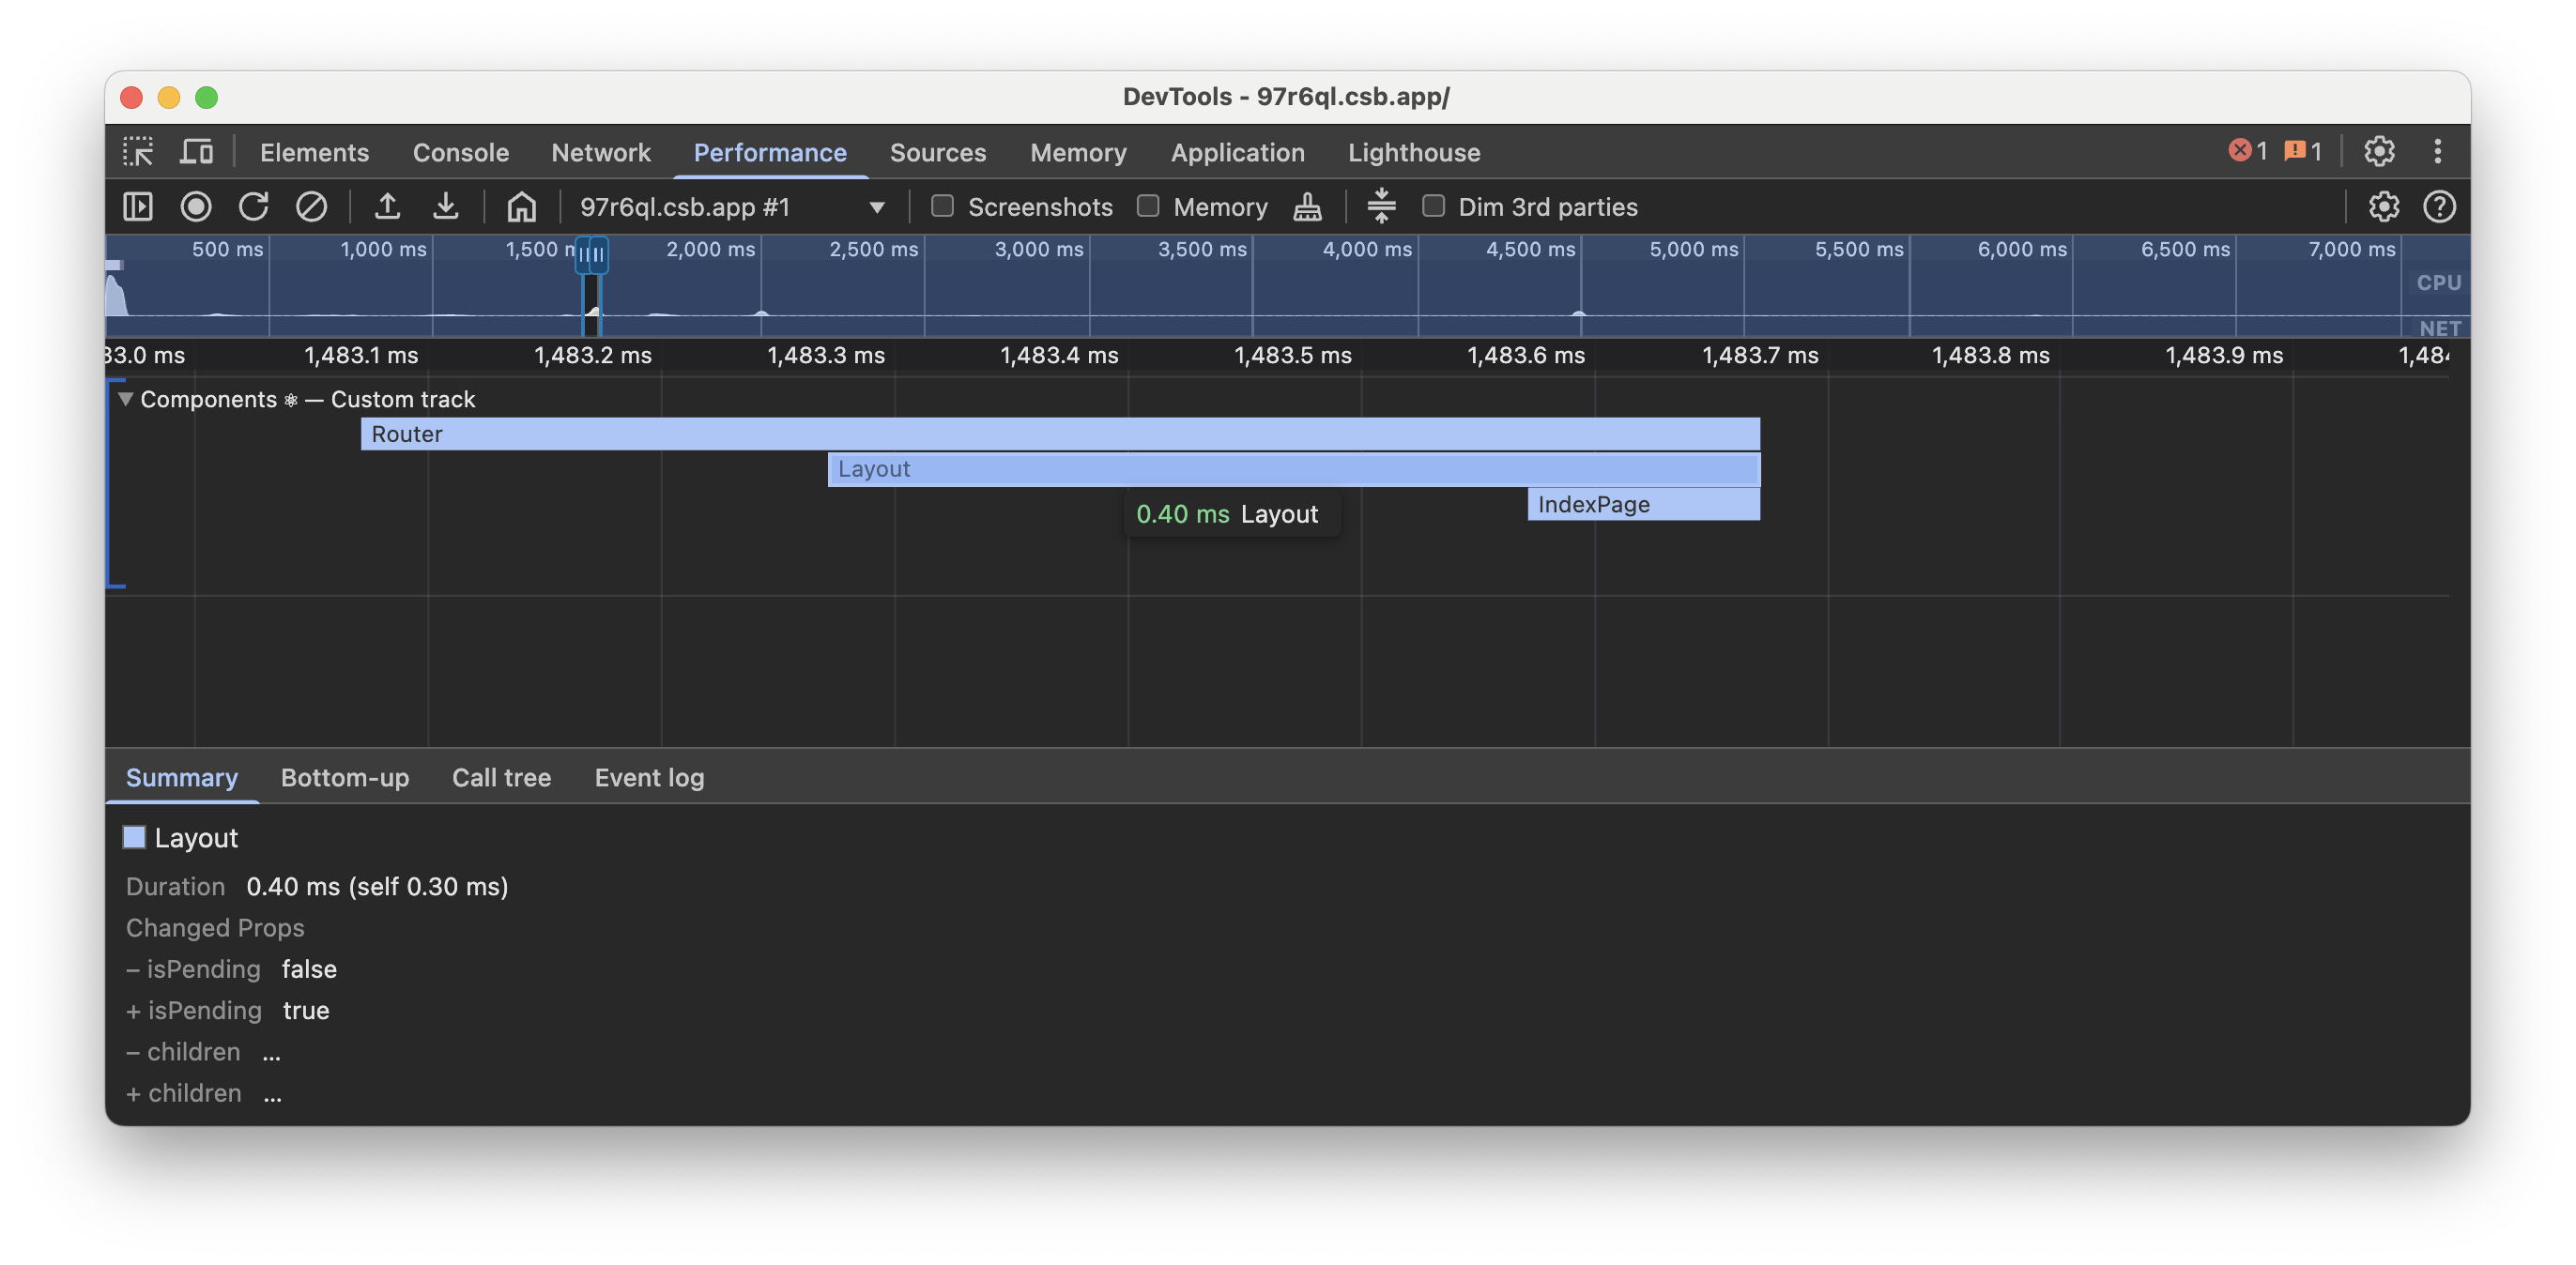
Changed props
In development builds, when you click on a component render entry, you can inspect potential changes in props. You can use this information to identify unnecessary renders.
Server
Server Requests
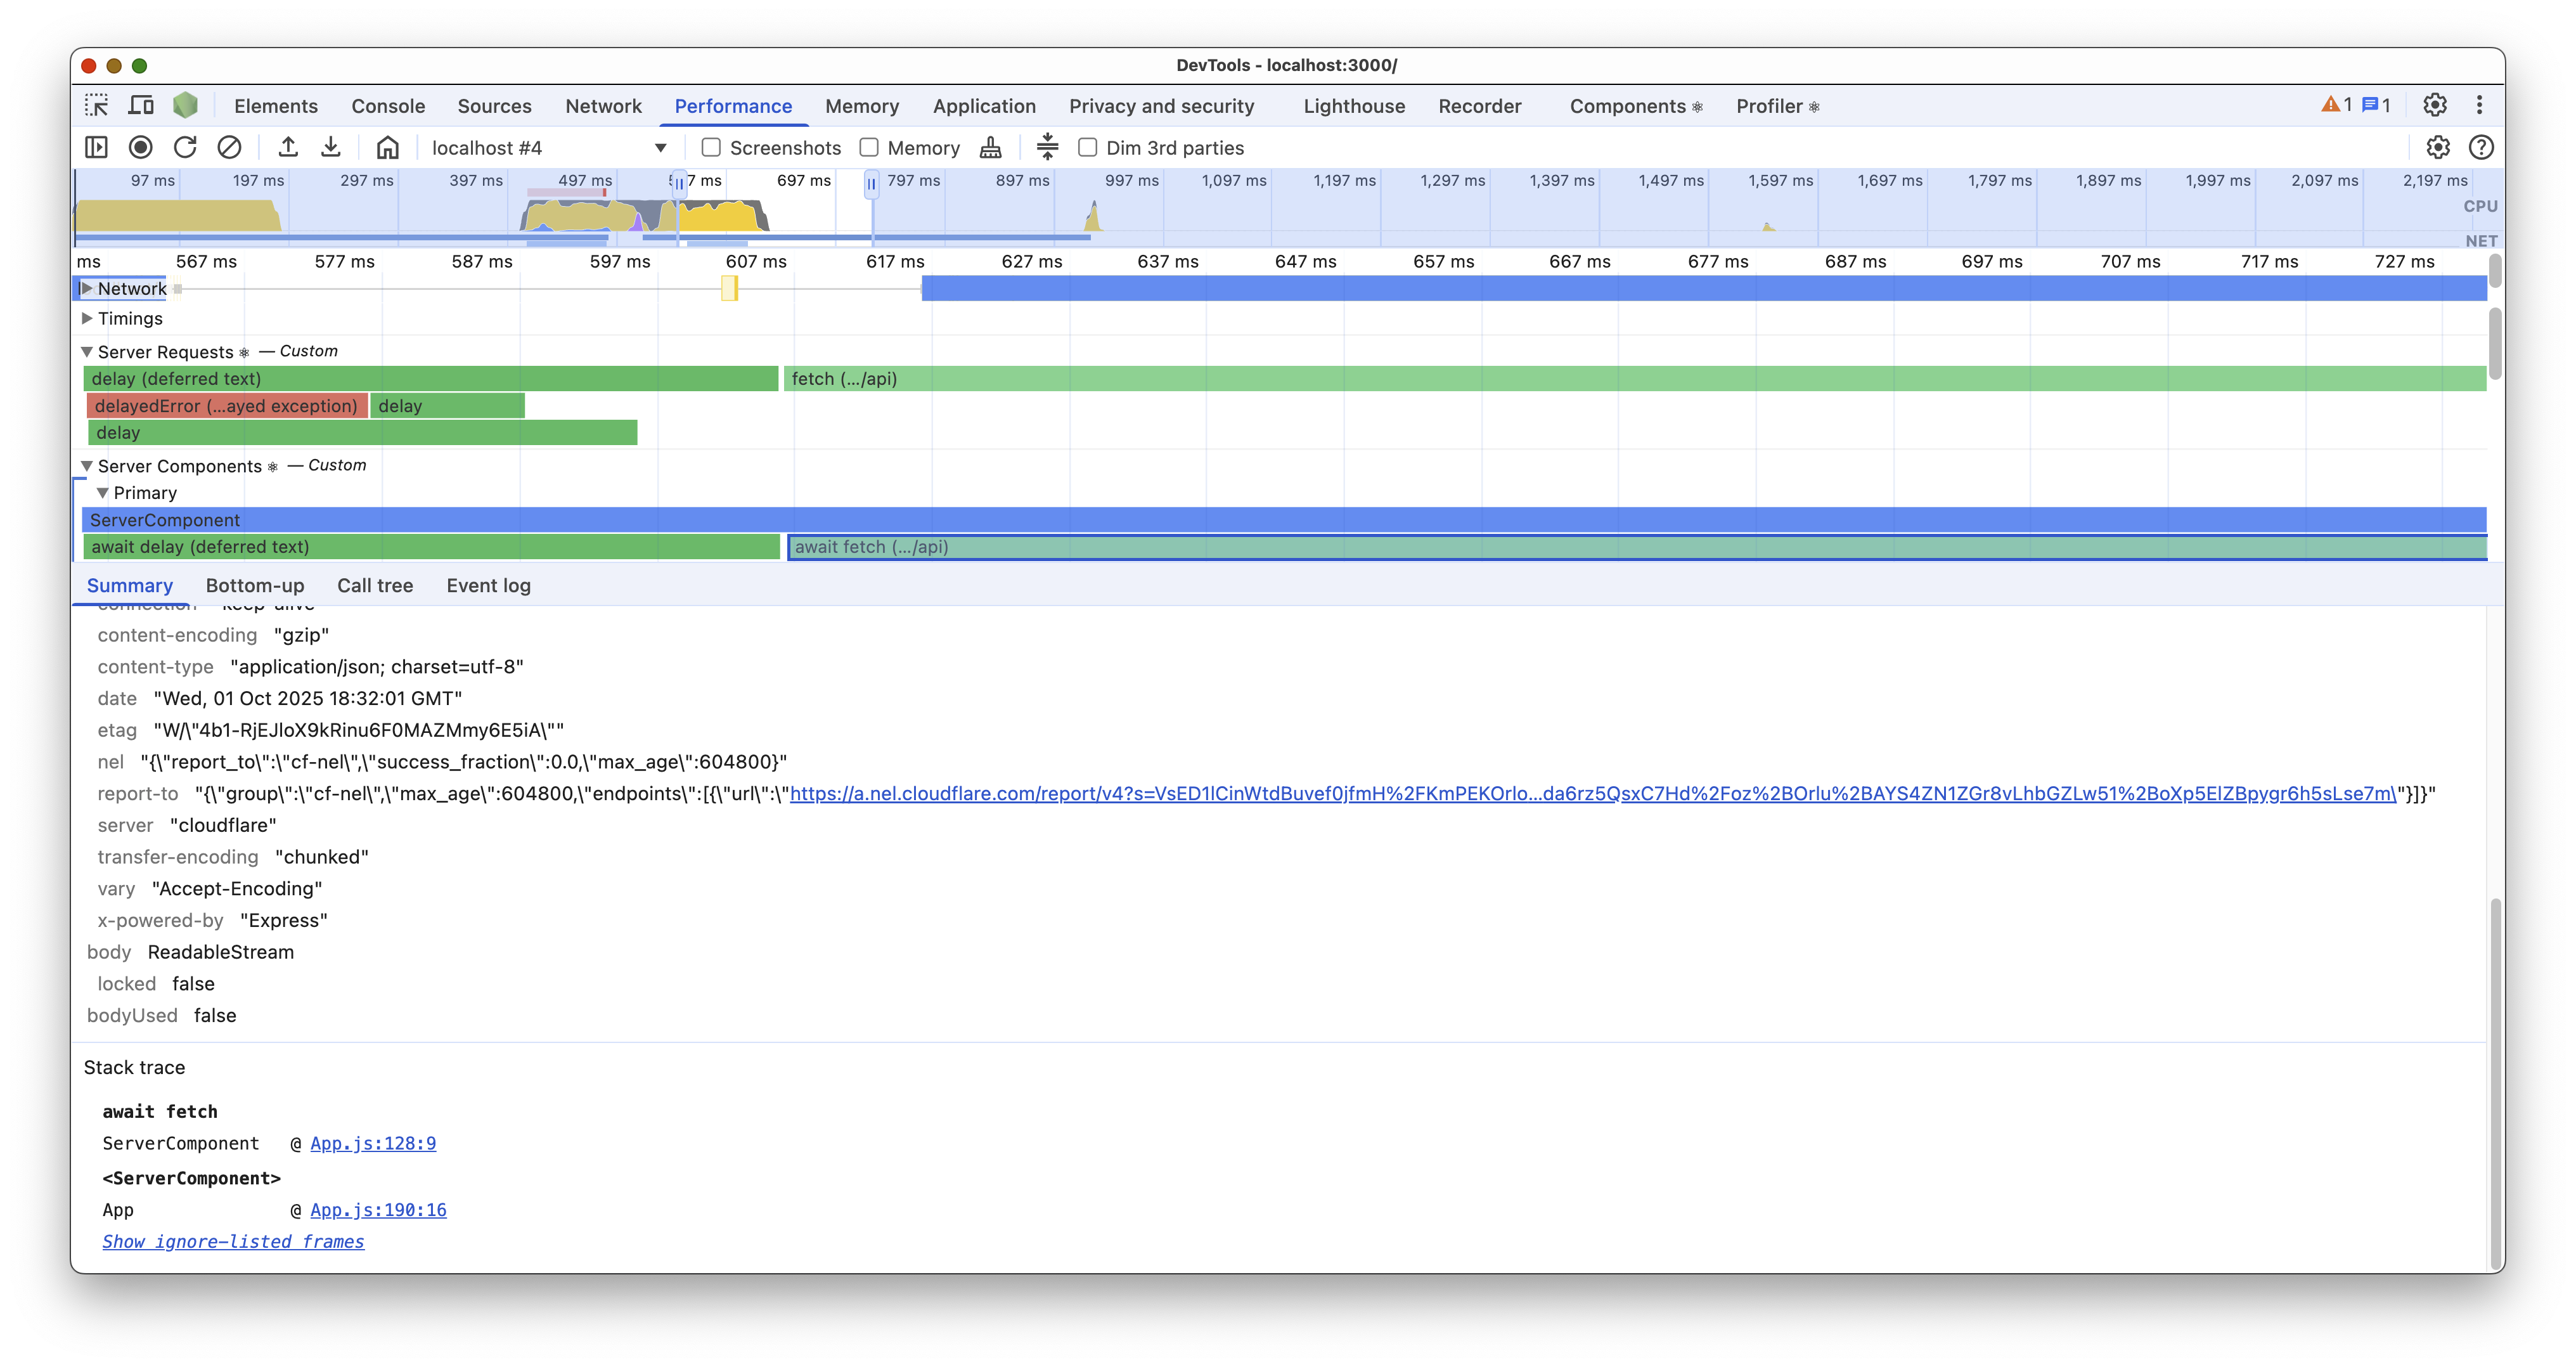
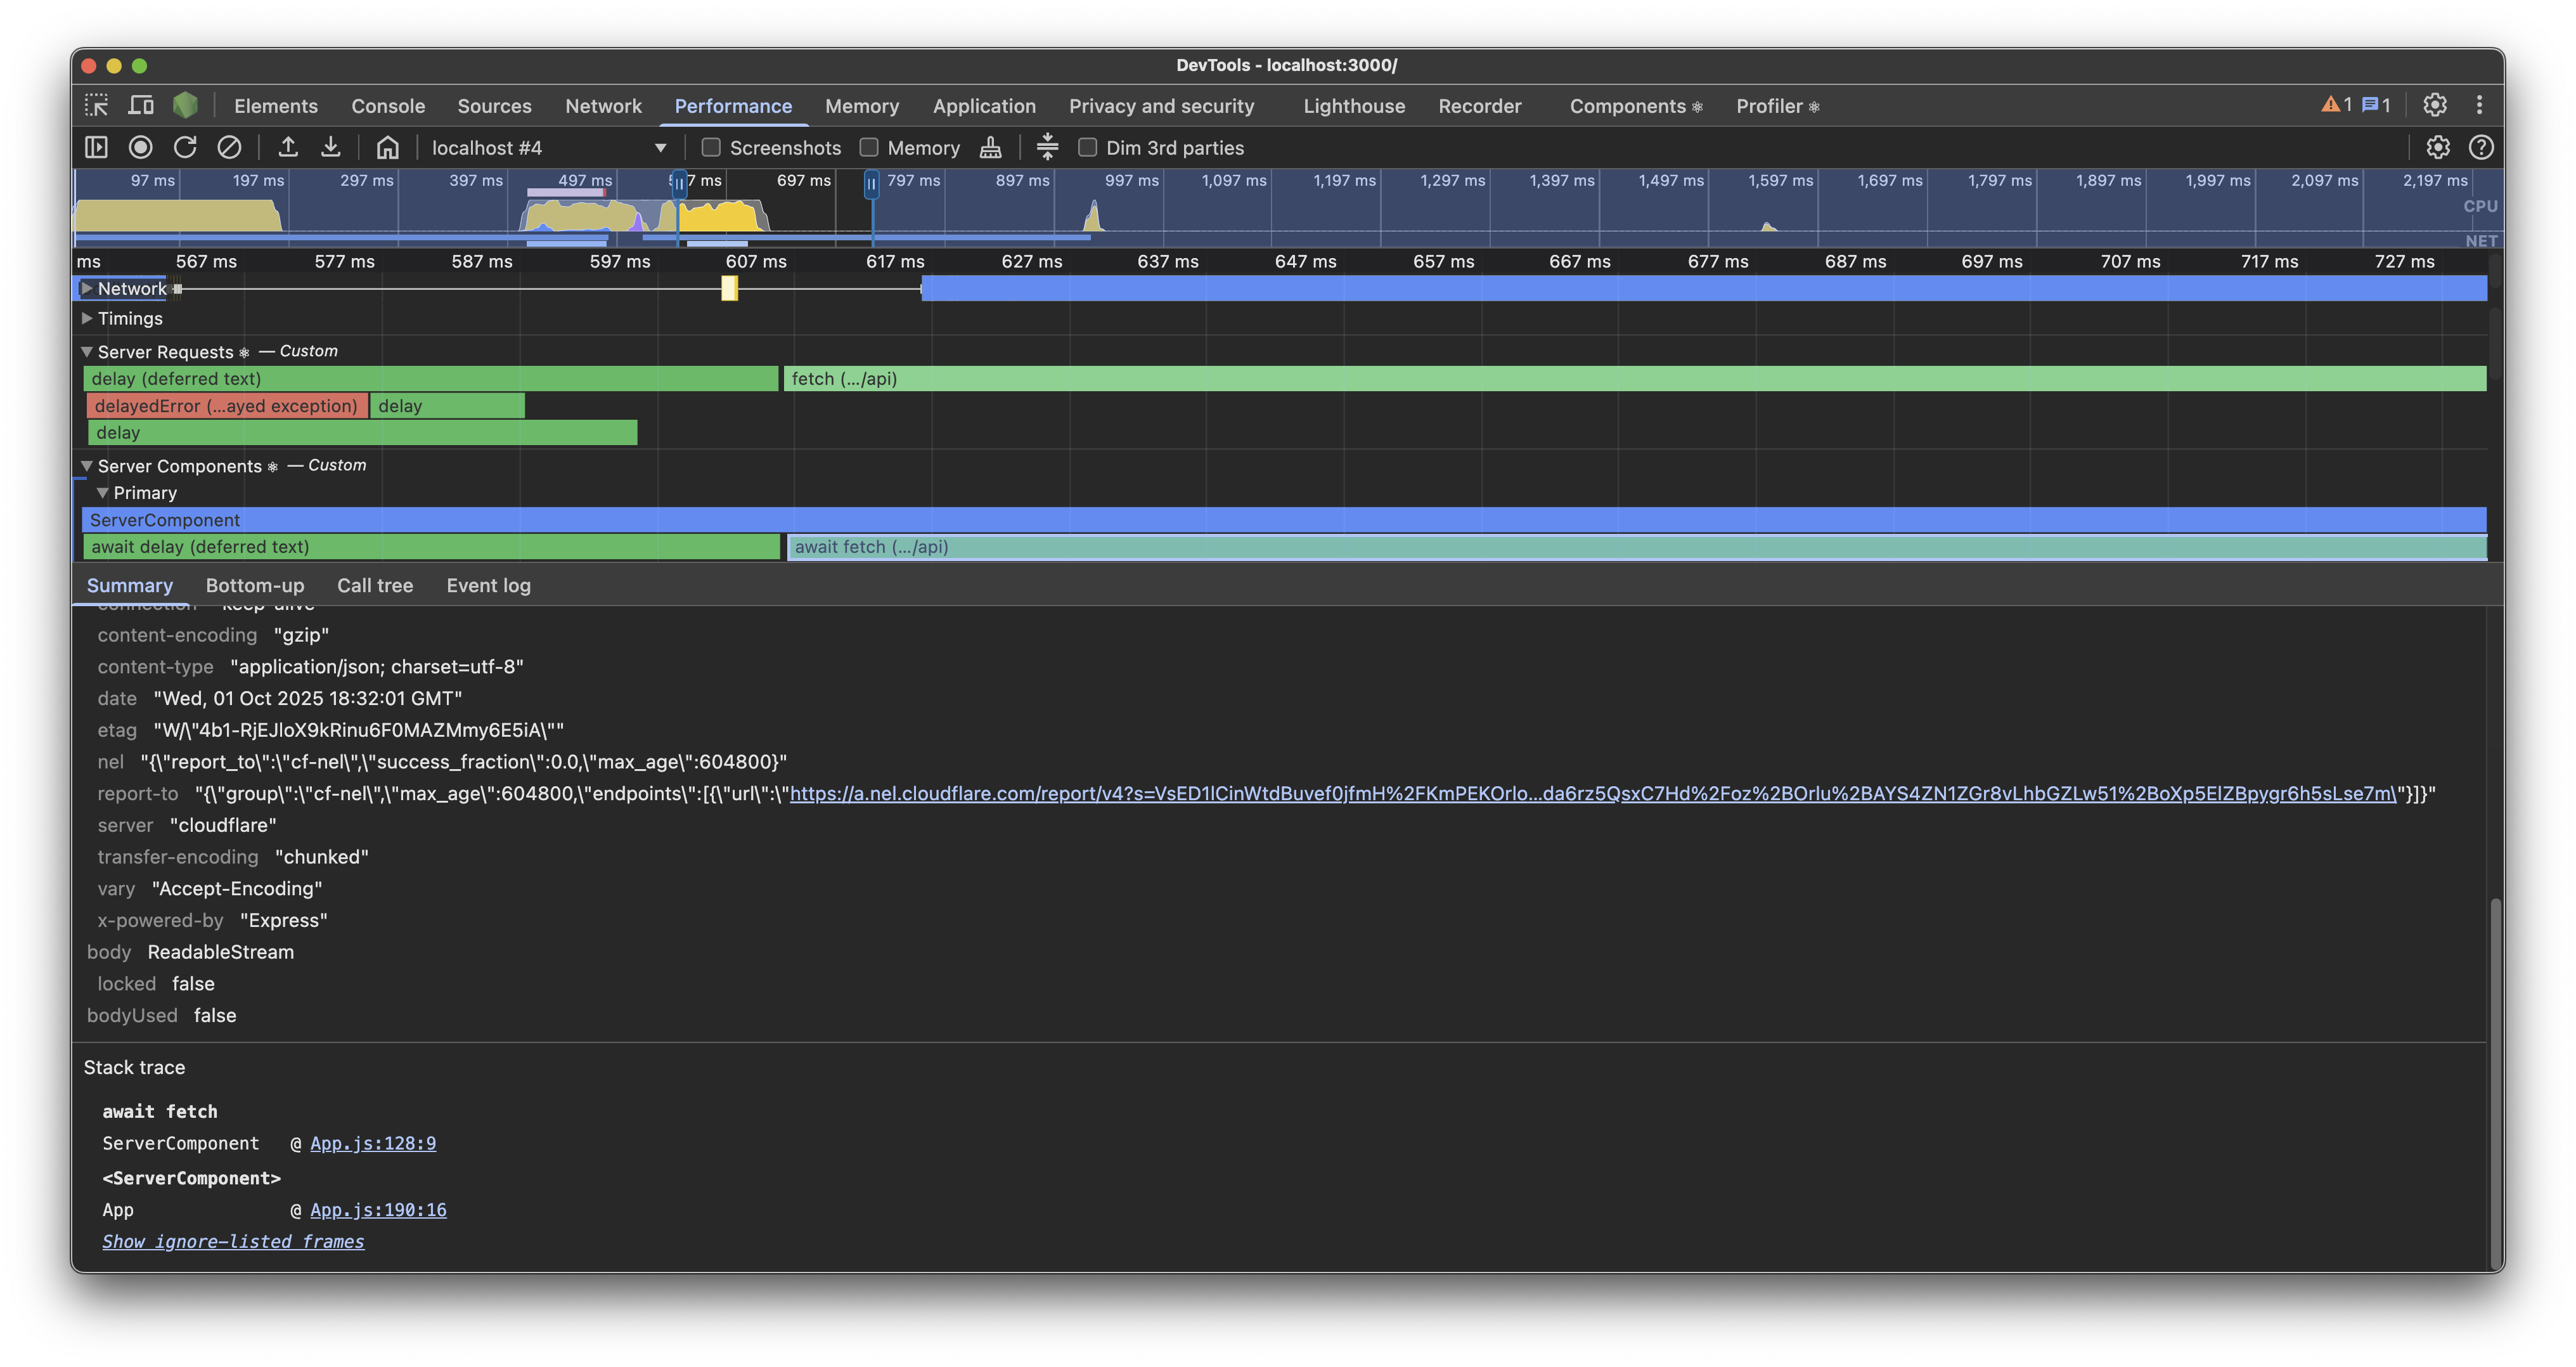
The Server Requests track visualized all Promises that eventually end up in a React Server Component. This includes any async operations like calling fetch or async Node.js file operations.
React will try to combine Promises that are started from inside third-party code into a single span representing the the duration of the entire operation blocking 1st party code.
For example, a third party library method called getUser that calls fetch internally multiple times will be represented as a single span called getUser, instead of showing multiple fetch spans.
Clicking on spans will show you a stack trace of where the Promise was created as well as a view of the value that the Promise resolved to, if available.
Rejected Promises are displayed as red with their rejected value.
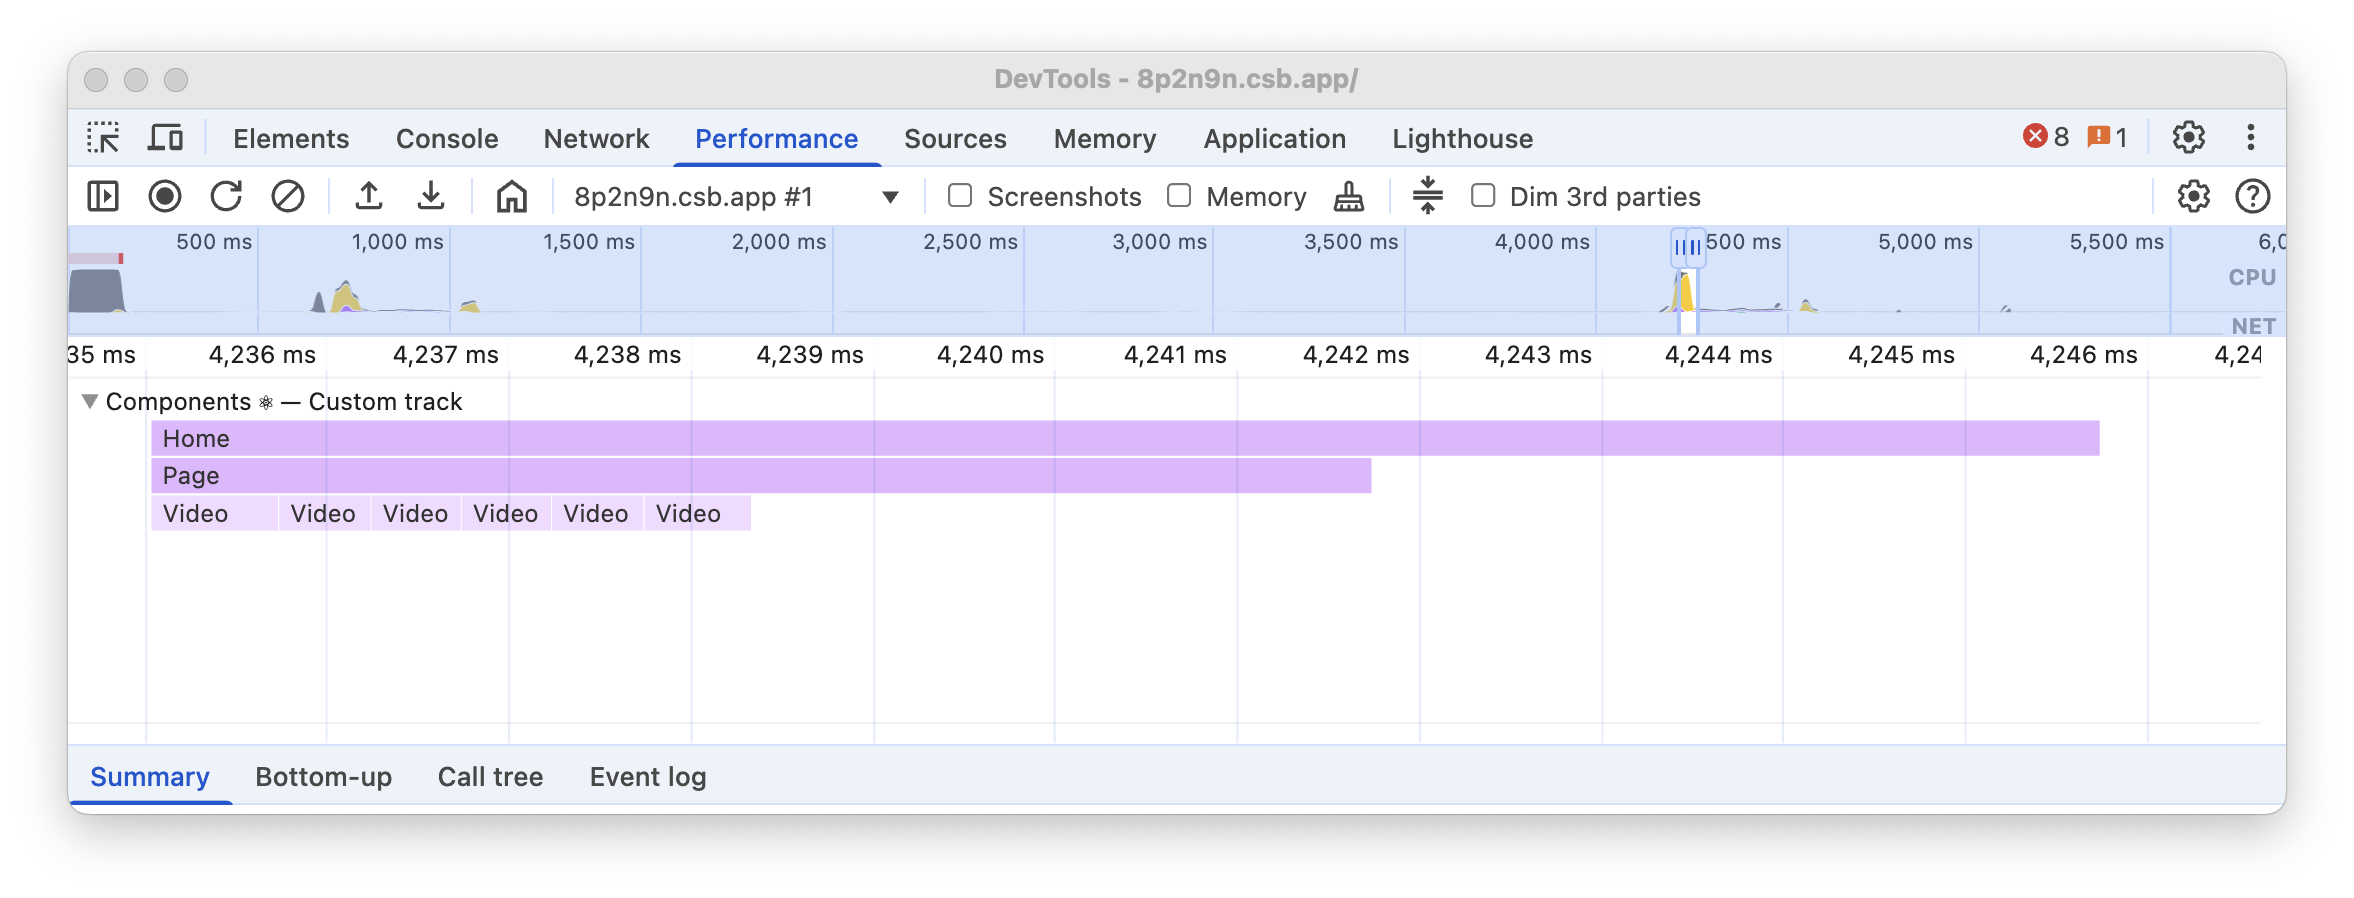
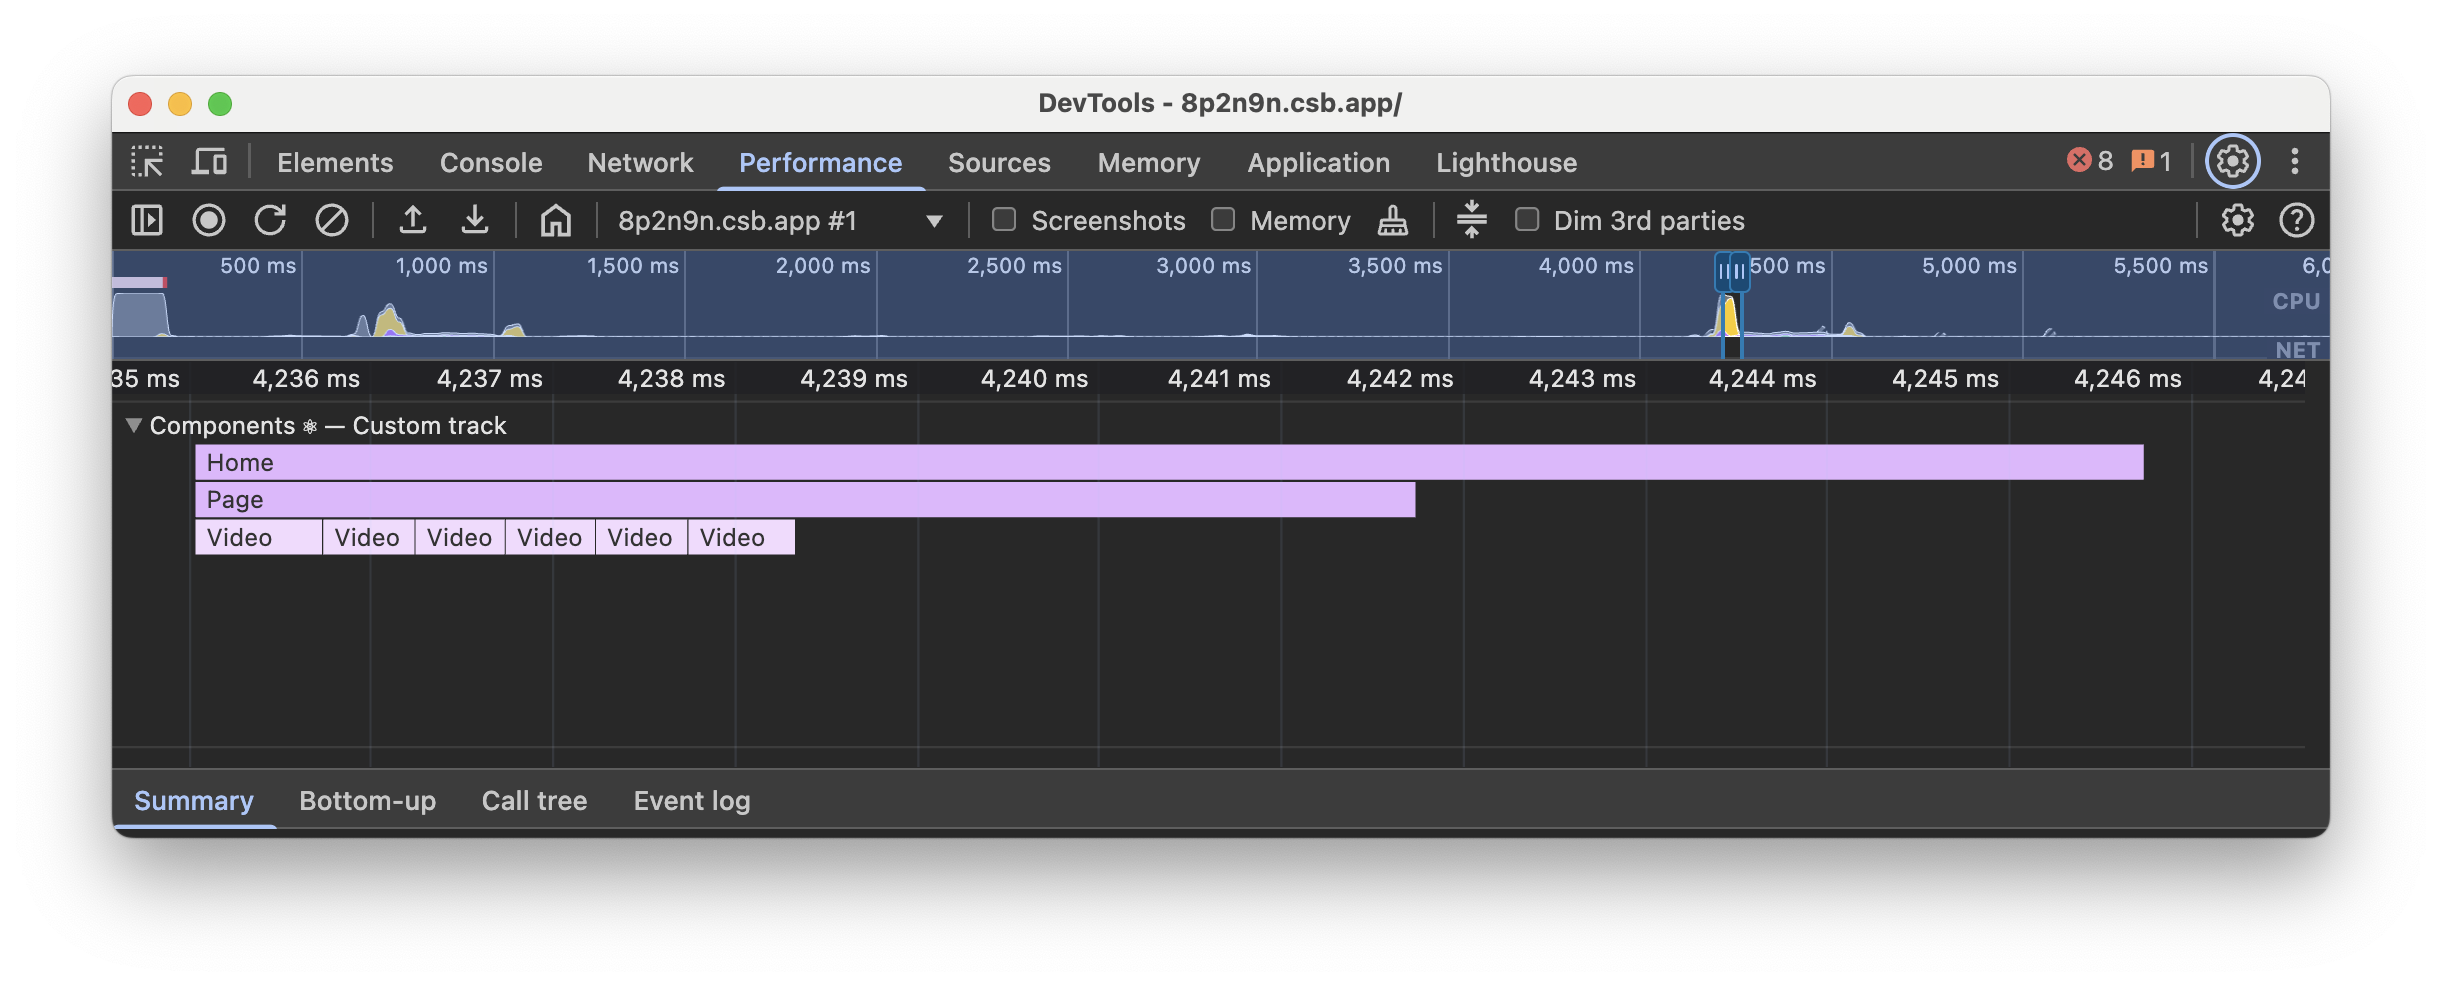
Server Components
The Server Components tracks visualize the durations of React Server Components Promises they awaited. Timings are displayed as a flamegraph, where each entry represents the duration of the corresponding component render and all its descendant children components.
If you await a Promise, React will display duration of that Promise. To see all I/O operations, use the Server Requests track.
Different colors are used to indicate the duration of the component render. The darker the color, the longer the duration.
The Server Components track group will always contain a “Primary” track. If React is able to render Server Components concurrently, it will display addititional “Parallel” tracks. If more than 8 Server Components are rendered concurrently, React will associate them with the last “Parallel” track instead of adding more tracks.